In the previous weekly note, we had expected the markets to show limited upsides and had also noted some possibility of the NIFTY slipping into some consolidation. The previous week remained quite volatile and the NIFTY oscillated in a violent and volatile way for the first four days of the week, while showing no clear directional bias. Just when it was consolidating on expected lines and in a defined range, though, the US Bond Yield spike on Thursday saw the last day of the week staying particularly weak and one of the worst in recent times. In the end, the headline Index NIFTY50 ended with a net loss of 462.30 points (-3.02%) on a weekly basis.
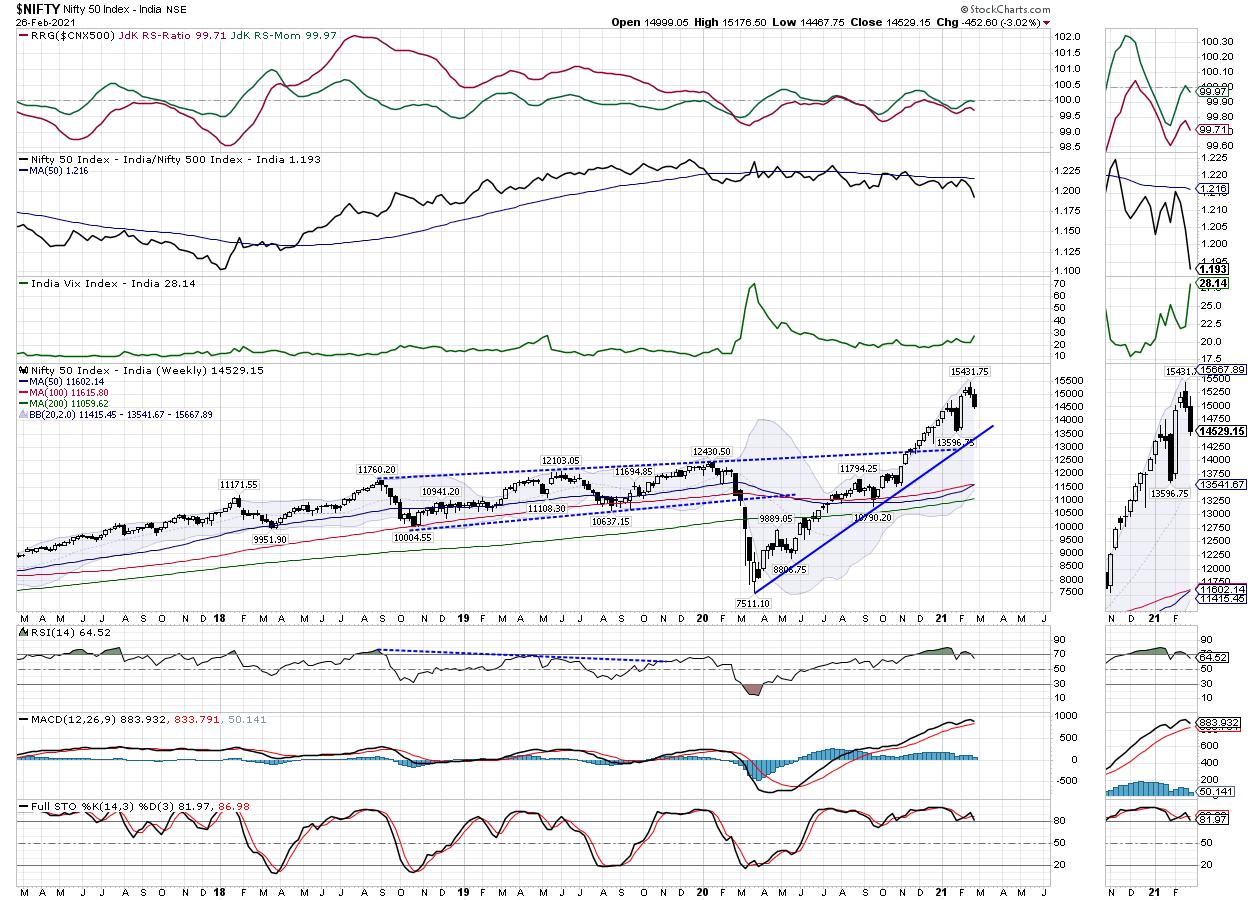
The week was positive until Thursday, but Friday's loss of 568.20 points wiped out the gains of the first four days and saw the week ending with a sizeable cut. The volatility also spiked significantly on the expected lines. While the INDIAVIX had stayed largely unchanged in the previous week, it spiked 26.48% this week to 28.14 by end. Although the NIFTY remains overextended vis-à-vis its short-term averages on the weekly chart, it has tested its 50-DMA, which stands at 14444. The NIFTY PCR across all expiries stays evenly placed at 1.01; this means that Call and Puts across all expiries have near similar OI, which puts the markets evenly placed.
Given the kind of vertical decline that we have witnessed, the start of the week can be on a positive note and some technical pullback can be expected. However, going ahead in the week, the upsides will continue to stay capped and limited in their extent. The levels of 14650 and 14850 will act as potential resistance points; the supports will come in at the 14450 and 14300 levels.
The weekly RSI stands at 64.52; it remains neutral and does not show any divergence against the price. It has slipped below 70 from the overbought formation, which is bearish. The weekly MACD is bullish and remains above the signal line. However, the narrowing slope of the Histogram points at the deceleration of the momentum. A large black candle occurred; this showed a general consensual directional bias of the participants.
Despite a decline of over 3% this week, the NIFTY is highly deviated and ahead of its curve on the weekly charts. The pattern analysis shows that even the faster 20-Week MA is still away by ~1000 points at 13541. It is important to note that this does not imply that the markets will decline 1000 points. However, it does imply that we may see ourselves oscillating in a defined range while the markets consolidate in a broad zone.
On various occasions, we had also mentioned the impending risks that the emerging markets face due to a spike in US bond yields. This continues to remain a concern along with the resilient US Dollar Index. We recommend continuing to stay light on positions and also remaining highly selective and stock-specific while approaching the markets. We expect select pockets to Mid-Caps and defensive stocks show continued improvement in their Relative Strength against the broader markets.
Sector Analysis for the Coming Week
In our look at Relative Rotation Graphs®, we compared various sectors against CNX500 (NIFTY 500 Index), which represents over 95% of the free float market cap of all the stocks listed.
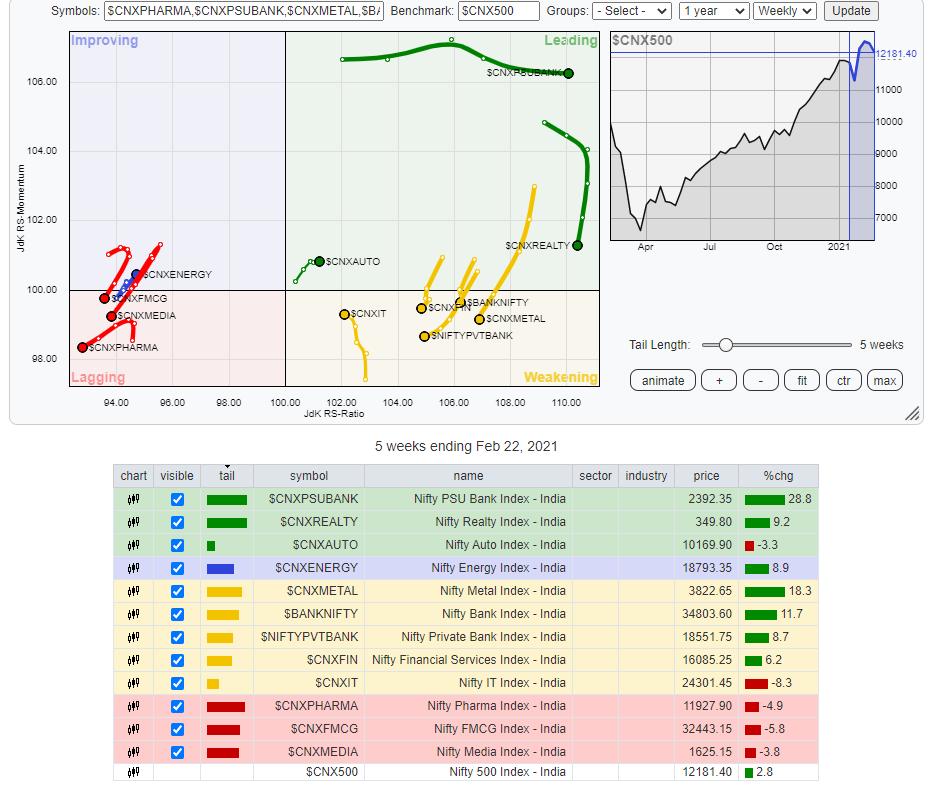
The review of Relative Rotation Graphs (RRG) shows that the Nifty Auto Index is the only one that is currently placed in the leading quadrant. Given the technical structure of the markets, it becomes important to understand that merely being placed in the leading quadrant may not mean absolute gains; it means that a particular Index/security may just put up relative outperformance against the benchmark.
The NIFTY Mid Cap 100 Index is in the weakening quadrant, but it appears to be turning back and attempting to improve its relative momentum just like the IT Index is doing over the previous weeks. The NIFTY Financial Service Index, Services Sector, BankNIFTY, and Metal Index are all in the weakening quadrant and may continue to relatively underperforming the broader markets, barring some few stock-specific shows.
NIFTY Media and Pharma continue to languish in the lagging quadrant. The NIFTY FMCG and Consumption Indexes have also slipped inside the lagging quadrant as they rolled over from the improving quadrant. All these Indices are expected to relatively underperform the broader markets.
NIFTY Energy has rotated inside the improving quadrant. This points at a likely end to its prolonged relative underperformance against the broader NIFTY 500 Index. The NIFTY PSE and Infrastructure Indexes appear to be steadily maintaining their relative momentum while being placed inside the improving quadrant.
Important Note: RRG™ charts show the relative strength and momentum for a group of stocks. In the above chart, they show relative performance against NIFTY500 Index (Broader Markets) and should not be used directly as buy or sell signals.
Milan Vaishnav, CMT, MSTA
Consulting Technical Analyst,


