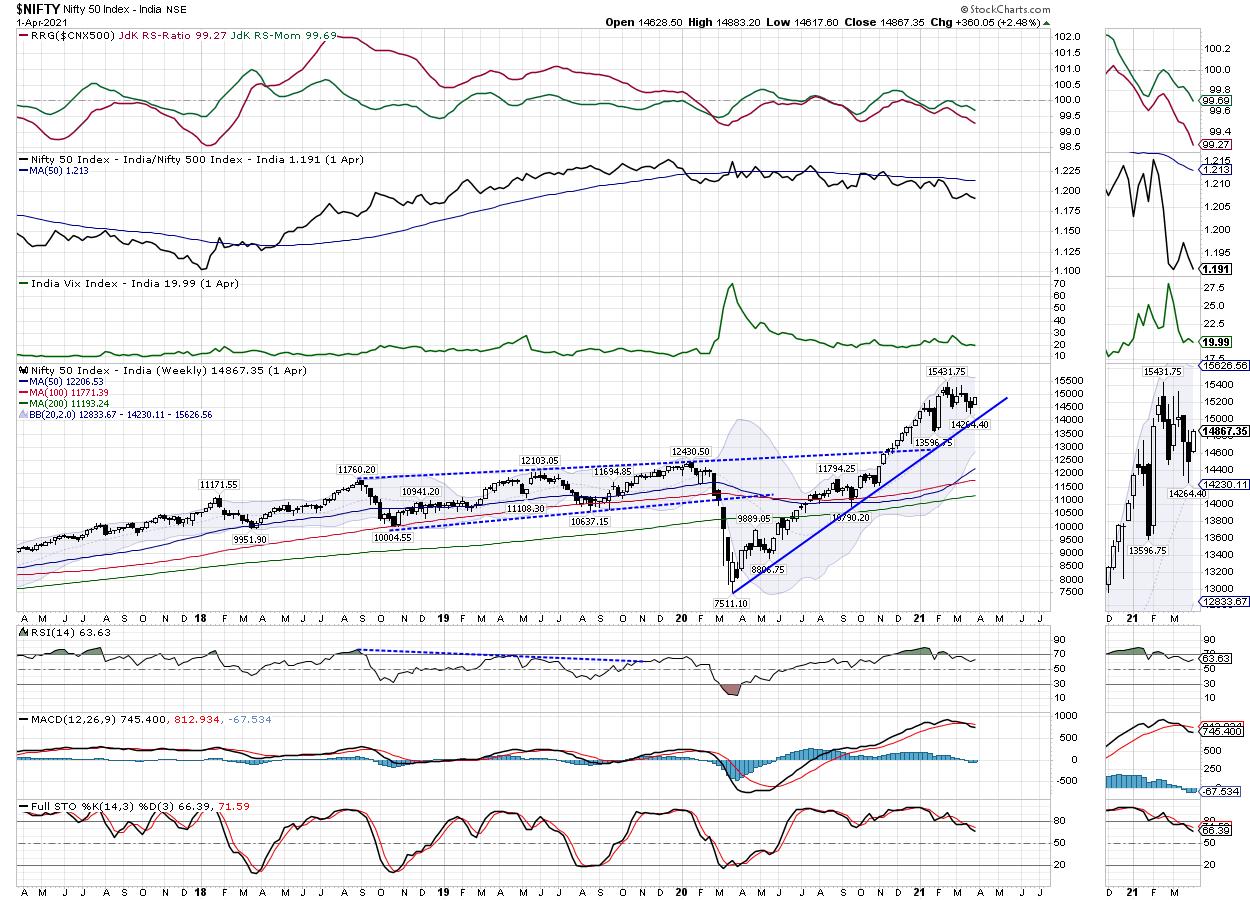
The previous week was a short and truncated one with just three working days. The NIFTY stayed volatile on the expected lines and danced to yield and a stronger dollar on the expected lines, but continued to post some gains. On the weekly charts, the Index stayed much in a defined range and inside the retracement channel that it has formed for itself. Given the lesser number of trading days, the overall moves remained limited as the Index trading in a 265-point range. While continuing to stay exactly in the middle of the retracement range and above the major upward rising trend line, the headline Index ended with net gains of 360.05 points (+2.48%) on a weekly basis.
The NIFTY will walk the double-edged sword in the coming week. The global markets are buoyant, with S&P 500 testing 4000+ levels for the first time. The Indian markets enjoy a strong correlation with the S&P 500 on weekly basis; the correlation on the daily basis stands a bit disturbed. On the other hand, the US Dollar Index (DXY) has tested the levels above 93 before cooling off a bit, while the bond yields have not cooled down much from their 14-month highs. This global trade setup has made sure that even if the domestic markets post incremental gains, it will not be without some volatility ingrained in it.
The 20-week MA, which presently stands at 14230, is the most crucial support for the NIFTY in the near term. This 20-week MA is acting as almost a proxy trend line for the Index as it runs along with the upward rising trend line drawn from the low point seen in March 2020. The coming week will see the levels of 14950 and 15165 acting as resistance points; the supports will come in at 14600 and 14450 levels. The trading range is expected to get wider in the coming week.
The weekly RSI stands at 63.63; it remains neutral and does not show any divergence against the price. The weekly MACD is bearish and trades below its signal line. No significant formations were noticed on the candles.
The pattern analysis shows that while the NIFTY continues to stay in the major upward rising channel, over the past weeks it has reverted to its mean. The Index had seen a sharp deviation from its mean and, currently, it is just correcting its phenomenon. The 20-week MA remains one of the most important support levels in the near term; this weekly MA also acts as a proxy trend line of the rising channel that the Index is trading in.
Broadly speaking, the NIFTY has hurdles to cross at the 15000 level, as this point holds maximum CALL OI and addition of CALL OI for this week. Apart from this, from the technical perspective, the markets may stay in a broad consolidating range for some more time. The texture of the markets is not only likely to get defensive, but stock-specific as well. It is recommended that you stay highly selective and keep overall exposures at modest levels. The defensive pockets like IT, Pharma and FMCG may show resilient behavior over the coming week.
Sector Analysis for the Coming Week
In our look at Relative Rotation Graphs®, we compared various sectors against CNX500 (NIFTY 500 Index), which represents over 95% of the free float market cap of all the stocks listed.
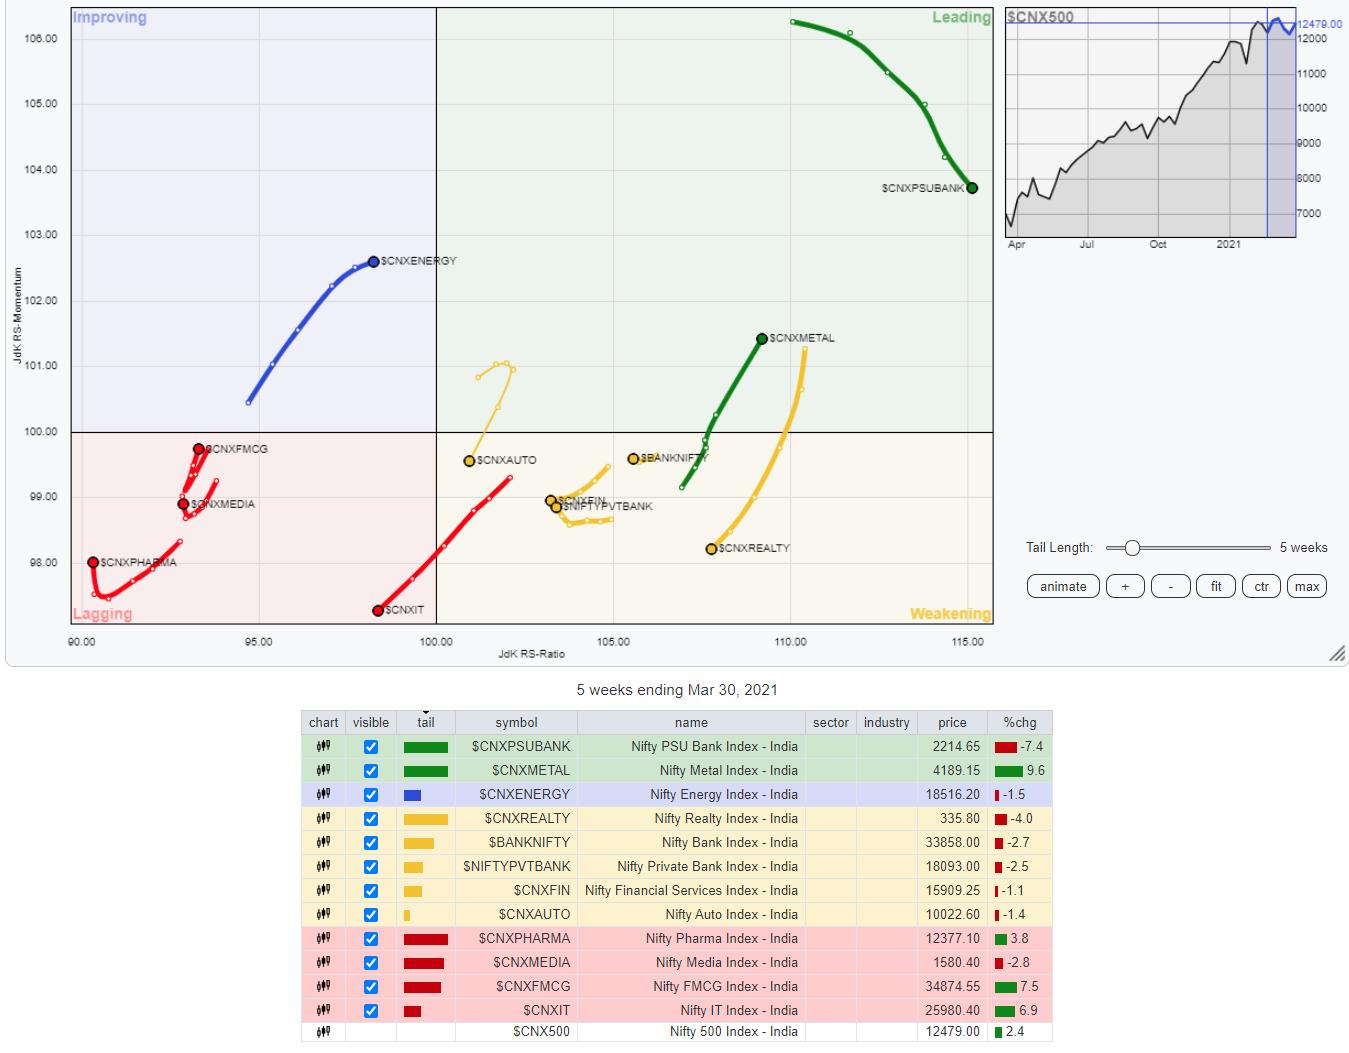
The review of Relative Rotation Graphs (RRG) shows the NIFTY Commodities Index and the NIFTY MIDCAP100 index remain firmly placed in the leading quadrant, along with NIFTY PSE and the Metal Index. These four sectors are likely to continue relatively outperforming the broader NIFTY 500 Index. The Small-Cap, Infrastructure and PSU bank Indexes are also in the leading quadrant, but they appear to be paring their relative momentum. However, stock-specific moves can be seen within these groups.
The NIFTY Auto Index has rolled inside the weakening quadrant, hinting at a likely end to its relative outperformance. The NIFTY Bank, Services Sector, Realty and Financial Services Index remain in the weakening quadrant.
The NIFTY Consumption Index languishes in the lagging quadrant. The FMCG, Media and Pharma Indexes are also inside the lagging quadrant, but they appear to be attempting to improve on the relative momentum front.
The NIFTY Energy Index is still inside the improving quadrant; it appears to be maintaining its relative momentum against the broader markets. This group may continue to show resilient performance against the broader markets.
Important Note: RRG™ charts show the relative strength and momentum for a group of stocks. In the above chart, they show relative performance against NIFTY 500 Index (Broader Markets) and should not be used directly as buy or sell signals.
Milan Vaishnav, CMT, MSTA
Consulting Technical Analyst,


