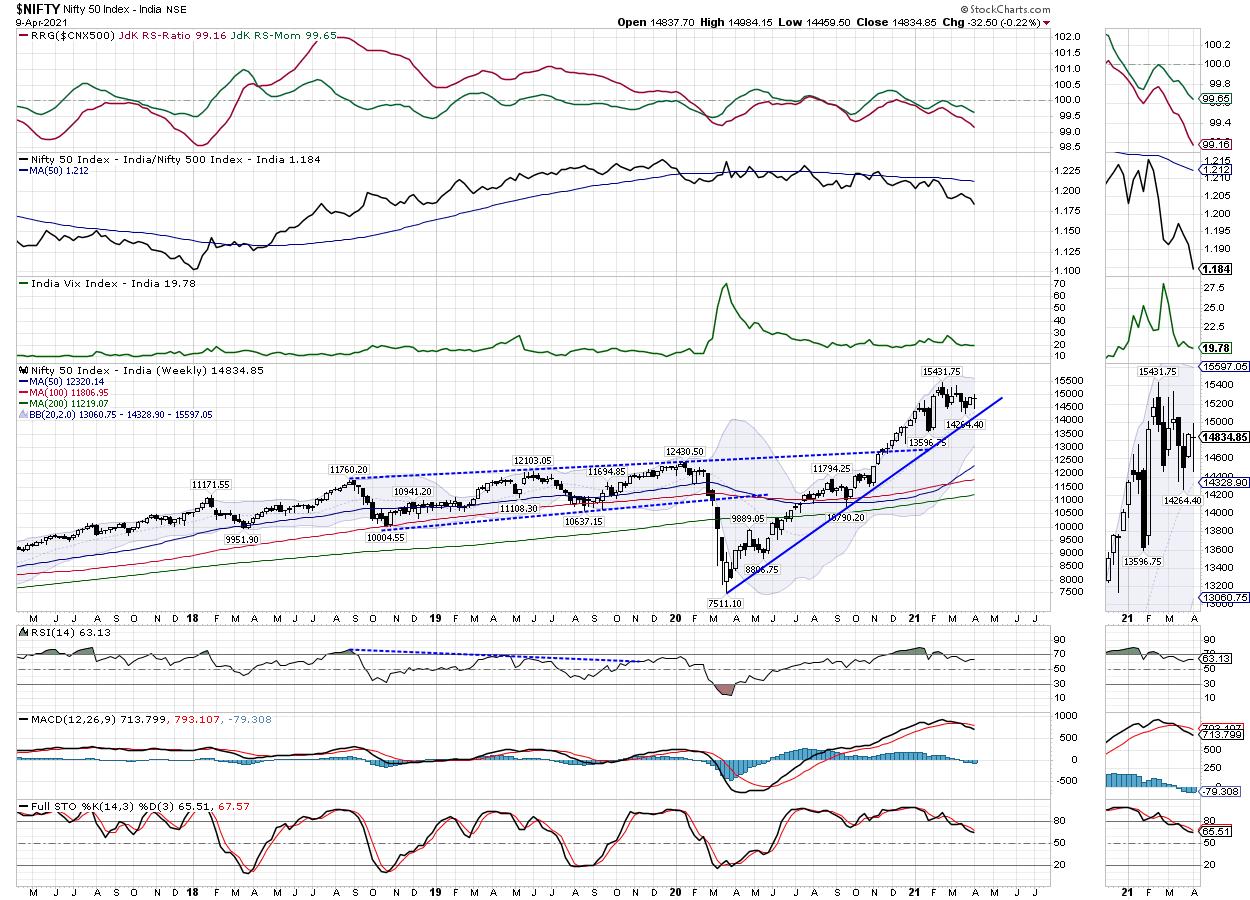
In a trading range that was wider than the previous week, the Indian equities did not make any directional headway and ended on a flat note over the past five days. On the expected lines, the NIFTY oscillated in a wider range, but stayed within the falling channel that the Index has formed following the formation of its lifetime high. The NIFTY saw itself moving in a 524-point range, with volatility remaining virtually absent. In the process, while the index stayed above the major upper rising trend line, it dragged its supports higher as well. Following a directionless week, the headline Index ended with a net loss of 32.50 points (-0.22%) on a weekly basis.
The coming week is a truncated one again, with Wednesday being a trading holiday on account of Dr. Babasaheb Ambedkar Jayanti. Given the present technical setup, the NIFTY continues to walk the double-edged sword, just like the week before his one. Despite the relatively buoyant global trade setup, the domestic markets have a strong resistance in the 15000-15100 area; moving past this would be of critical importance if the NIFTY must attempt to break above the present channel. The US Dollar Index, which has shown a sharp retracement of late, is likely to see a pullback once again, which is something the domestic markets will have to closely watch.
The volatility remained nearly absent; the INDIAVIX came off 1.01% to 19.78. The coming week is likely to see the levels of 15000 and 15150 acting as resistance points. The supports come in at 14600 and 14480 levels. In the event of the markets taking a directional cue on either side, the trading range is expected to be wider than usual.
The weekly RSI stands at 63.13; it remains neutral and does not show any divergence against the price. The weekly MACD is bearish and remains below its signal line. A Doji appeared on the candles; this reflects indecision and lack of any directional consensus on part of the participants.
The pattern analysis shows that the NIFTY is well above the support of the rising trend line drawn from the lows of March 2020. However, following marking a high at 15431, the Index is under a corrective retracement within a small falling channel. The NIFTY has also raised its supports higher, with the 20-Week MA acting almost as a proxy trend line; it is still at 14328 at present.
Overall, despite the markets not taking any directional cues, what was evident was the defensive play coming to the fore and the stock-specific performance of the markets. The broader markets relatively outperformed the front line index; this, along with the defensive approach, will continue to dominate the market performance in the coming week as well.
Sector Analysis for the coming week
In our look at Relative Rotation Graphs®, we compared various sectors against CNX500 (NIFTY 500 Index), which represents over 95% of the free float market cap of all the stocks listed.
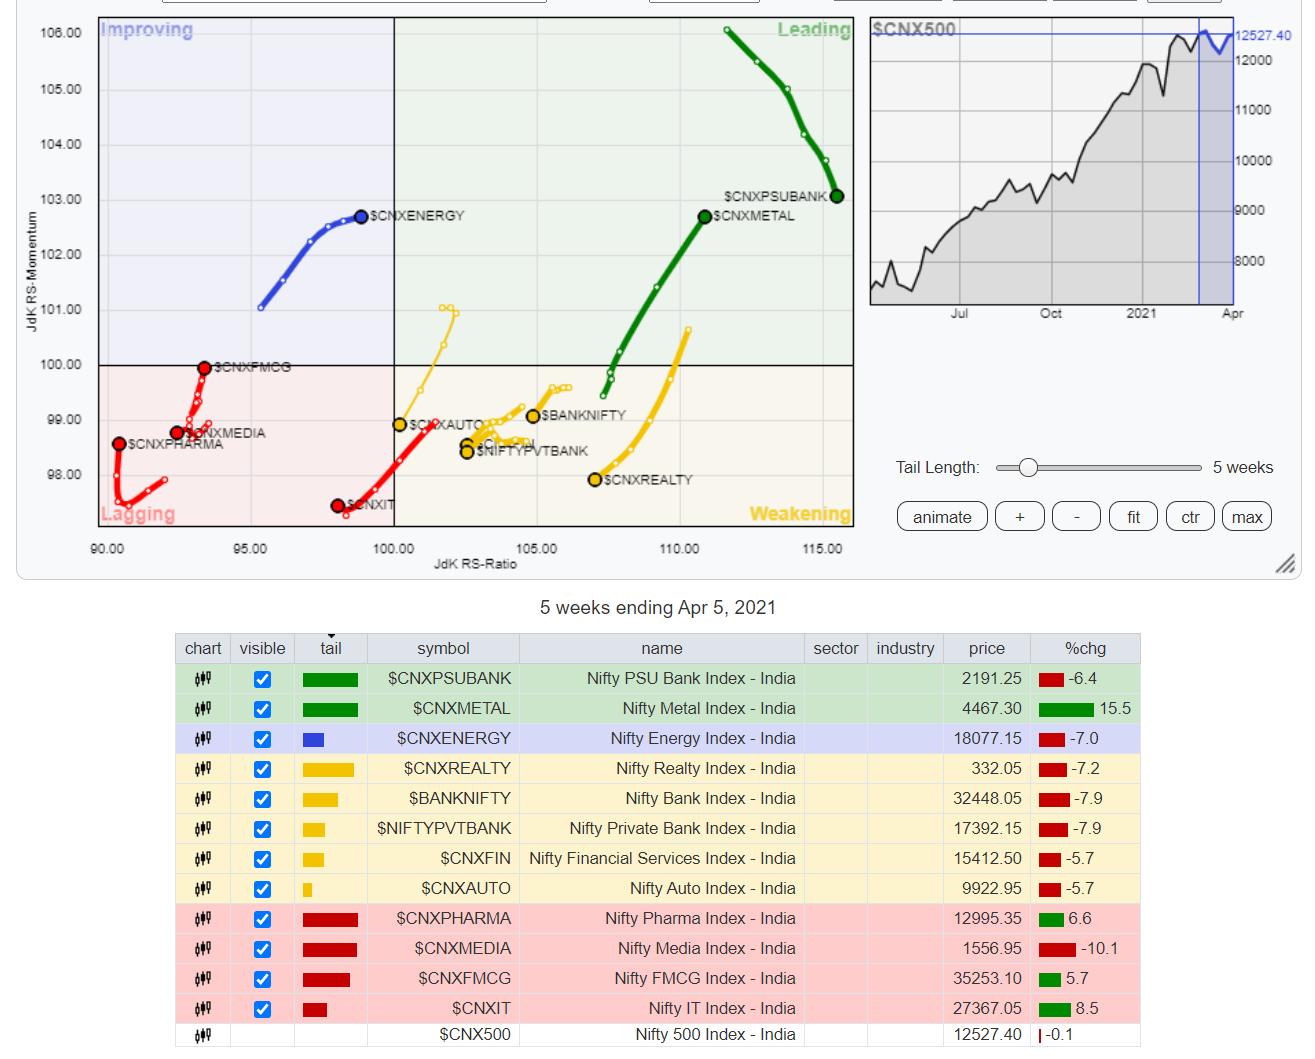
The review of Relative Rotation Graphs (RRG) shows that NIFTY Commodities, Metal, and Midcap 100 Indexes have continued to surge ahead while staying firm in the leading quadrant. NIFTY PSE and NIFTY Infrastructure also appear stable inside the leading quadrant. All these groups are likely to relatively outperform the broader markets. The PSUBANKS Index and the Small Cap Index are continuing to lose relative momentum despite being in the leading quadrant.
NIFTY Auto Index has further moved in the south-west direction while staying the weakening quadrant. Individual performances may be seen, but the Index, as such, may not show any resilient performance. The NIFTY Financial Services, NIFTY Services, NIFTY Bank and NIFTY Realty Indexes are inside the weakening quadrant and appear to be paring their relative momentum against the broader markets.
NIFTY IT is in the lagging quadrant, but it appears to have stopped its loss of momentum. A similar move is seen on the NIFTY Pharma and FMCG Indexes. NIFTY Media, however, pared its relative momentum as it languishes in the lagging quadrant.
NIFTY Energy is placed inside the improving quadrant. It appears to be moving steadily towards the leading quadrant while maintaining its relative momentum against the broader markets.
Important Note: RRG™ charts show the relative strength and momentum for a group of stocks. In the above chart, they show relative performance against NIFTY500 Index (Broader Markets) and should not be used directly as buy or sell signals.
Milan Vaishnav, CMT, MSTA
Consulting Technical Analyst,


