Despite intermittent hiccups in between, the past week stayed much better than expected for the Indian markets. The NIFTY not only averted the bearish consequence of the violation of the rising trend line, but it also went on to end the week while posting decent gains. As compared to the earlier week, the NIFTY traded in a bit wider range this time. It mostly oscillated in a 465-point range, with a bullish bias barring the two days of consolidation and throwback in between. While finishing the week on a broadly strong note, the headline Index NIFTY50 closed with net gains of 497.50 points (+3.39%) on a weekly basis.
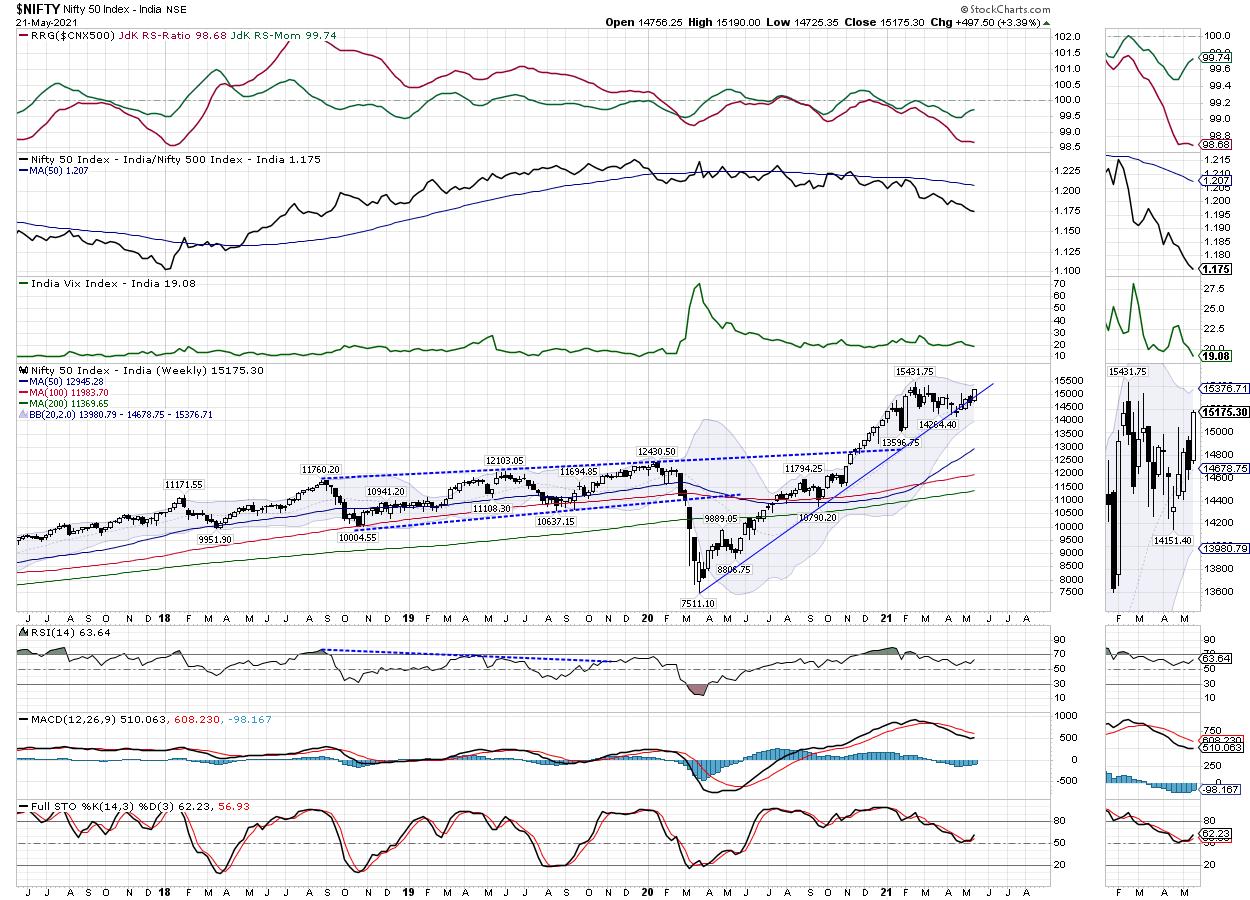
From a technical perspective, NIFTY has once again survived the violation of the breach of the rising trend line. This trend line begins from the lows of March 2020 and joins subsequent higher bottoms. Given the surge witnessed over the past five sessions, the Index is once again above this important pattern support. On the other hand, the volatility has declined significantly over the past five days. The INDIAVIX came off by another 5.86% to 19.08; it now trades very near to its lowest levels seen over the last many months.
Although the NIFTY has once again attempted to break out of the falling channel, it continues to show a lack of internal strength as measured by its lead indicators. However, the breadth data remains strong. The NIFTY PCR across all expiries stands at 1.38. The NIFTY with step into the first week with some likely consolidation; the levels of 15250 and 15325 will act as resistance, while the supports will come in at 15000 and 14880. The trading range for the markets is likely to stay a bit wider than usual.
The weekly RSI is 63.64. It shows a mild bearish divergence against the price. While the NIFTY marked a new 14-period high, the RSI did not, which resulted in a bearish divergence. The weekly MACD is bearish and remains below its signal line.
The pattern analysis of the weekly chart shows that the Index has once again attempted to break out of the falling channel created after the NIFTY marked its lifetime high of 15431. There are few contradictory signals that show that the NIFTY is showing negative divergences against the lead indicators; on the other hand, the breadth data remains strong.
In the present technical setup, so long as the upward momentum continues, it needs to be chased very cautiously. From now on, despite all secular up moves, if they happen at all, the quality of stocks that one holds will be of prime importance. We recommend chasing the up moves, if any, on a highly selective basis. The present technical setup also requires the market participants to stay highly vigilant at higher levels and guard profits. A highly selective approach is advised for the coming week.
Sector Analysis for the Coming Week
In our look at Relative Rotation Graphs®, we compared various sectors against CNX500 (NIFTY 500 Index), which represents over 95% of the free float market cap of all the stocks listed.
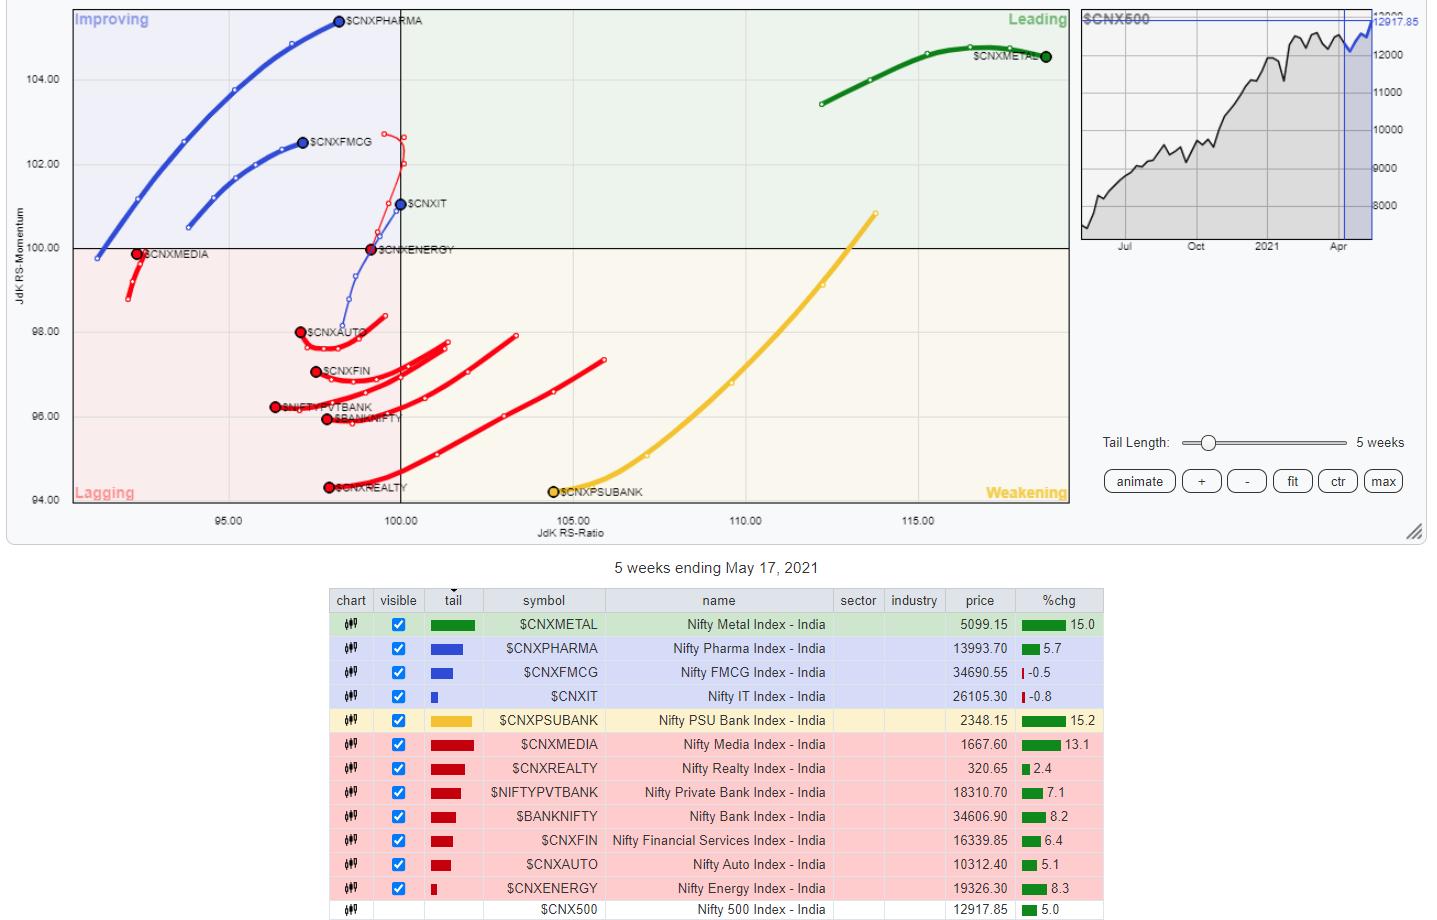
The review of Relative Rotation Graphs (RRG) shows that, just like the previous weeks, NIFTY Metal continues to make good strides inside the leading quadrant. Also, the Pharma, FMCG and Consumption are firmly placed inside the improving quadrant, while maintaining their relative momentum against the broader NIFTY500 Index.
The NIFTY IT Index has rolled inside the leading quadrant; it is likely to relatively outperform the broader markets. The NIFTY Small Cap, MIDCAP100, and Commodities indexes are inside the leading quadrant as well. They may relatively outperform, but only on a selective basis as they are seen paring their relative momentum.
The NIFTY PSE Index has slipped inside the weakening quadrant. The NIFTY Infrastructure Index also remains inside the weakening quadrant along with the PSUBank Index.
The NIFTY Services Sector Index, BankNifty, Realty, Financial Services and NIFTY Auto Indexes are all placed inside the lagging quadrant. The NIFTY Energy Index has also slipped back inside the lagging quadrant following sharp paring of relative momentum.
Important Note: RRG™ charts show the relative strength and momentum for a group of stocks. In the above chart, they show relative performance against NIFTY500 Index (Broader Markets) and should not be used directly as buy or sell signals.
Milan Vaishnav, CMT, MSTA
Consulting Technical Analyst,


