The truncated trading week stayed disappointing in more ways than one. Just when it appeared that the NIFTY had rectified its violation of the immediate and important trend line support, it has since violated it again while taking support on the short-term 20-week MA. The trading range remained a bit narrow as compared to the 446-point range witnessed in the week before this one. This time, the Index oscillated in a 375-point range before ending on a negative note. The headline index closed with a net loss of 145.35 points (-0.98%) on a weekly basis.
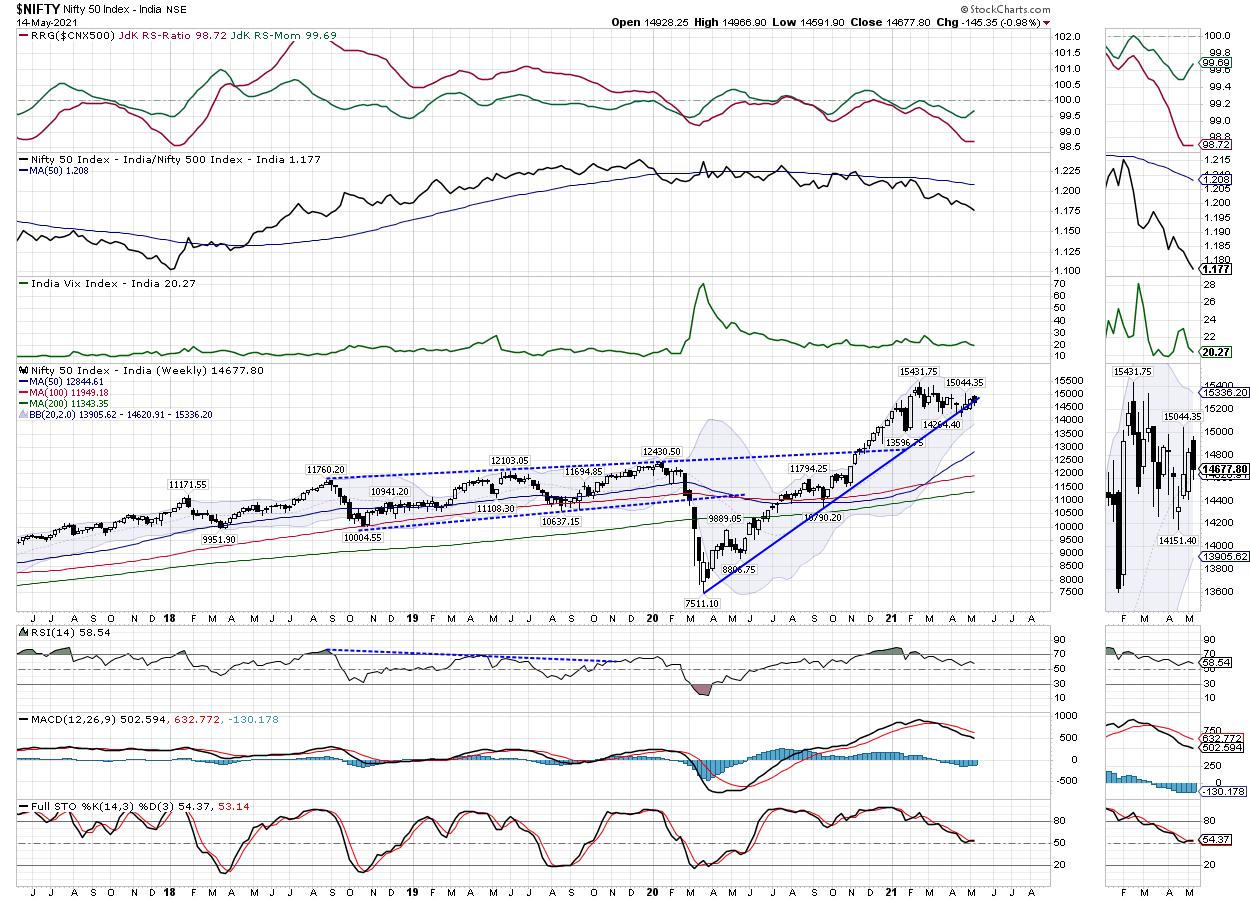
Looking at things from the technical perspective, the NIFTY has again violated and closed below the rising trend line support. This trend line begins from the lows of March 2020 and joins the subsequent higher bottoms. The Index has not only slipped below this trend line but, on the higher side, resisted precisely at the upper edge of the falling channel. This channel was created after the formation of the high point of 15431. This week, the NIFTY has taken support at a 20-week MA, which currently stands at 14620. Any violation of this level will allow some more weakness to creep into the markets. The rising trend line, which is violated, will now act as resistance when and if the NIFTY tries to move above it again.
Volatility continued to decline for this week as well. Last week, the volatility had declined significantly by 9.58%; this week, the INDIAVIX declined by 2.67% to 20.27 on a weekly basis. The coming week is likely to see the levels of 14750 and 14830 as resistance points. The supports will come in at the 14610 and 14505 levels.
The weekly RSI stands at 58.54; it remains neutral and does not show any divergence against the price. The weekly RSI is bearish and is still below the signal line. A black candle appeared; this denotes a directional consensus on the downside that persisted among the market participants throughout the week.
Overall, the pattern analysis continues to depict a weak technical structure on the charts. On one hand, the NIFTY resisted precisely at the upper edge of the falling channel that is created post the formation of the lifetime high of 15431. On the other hand on the lower side, it has violated the rising trend line, which is one of the important pattern supports. This trend line begins from the lows of March 2020 and joins the subsequent higher bottoms.
The analysis for the coming week remains on many similar lines. The 15000 continues to be a sacrosanct resistance point, the one lower than what exists at 14800. So long as the 14800-15000 levels are not convincingly taken out, we will see all up moves finding selling pressure at higher levels. The present texture of the markets has also turned highly defensive. The defensive stocks from IT, Pharma, FMCG and consumption are gaining relative strength; this phenomenon is likely to persist for the coming week as well. A highly cautious and defensive approach is advised for the coming week while keeping overall exposures at modest levels.
Sector Analysis for the Coming Week
In our look at Relative Rotation Graphs®, we compared various sectors against CNX500 (NIFTY 500 Index), which represents over 95% of the free float market cap of all the stocks listed.

The review of Relative Rotation Graphs (RRG) shows that, on the anticipated lines, NIFTY Metal continues to make good strides inside the leading quadrant. Also, the Pharma, FMCG and Consumption Index are also seen rotating strongly inside the improving quadrant, along with the IT Index which also stays inside the improving quadrant. All these indices are likely to relatively outperform the broader NIFTY500 Index.
The Small-Cap, Commodities, NIFTY MIDCAP 100 and the PSE index are also inside the leading quadrant. However, they appear to be losing their relative momentum against the broader markets. The NIFTY PSU BANK and the Infrastructure indexes are inside the weakening quadrant and appear to be giving up on their relative momentum.
The NIFTY Realty index has rolled over inside the lagging quadrant. The NIFTY Bank and Services sector indexes also continues to languish inside the lagging quadrant, along with the Media Index. The NIFTY Auto and the Financial Services Index are also inside the lagging quadrant. All these groups are likely to relatively underperform the broader markets.
Important Note: RRG™ charts show the relative strength and momentum for a group of stocks. In the above chart, they show relative performance against NIFTY500 Index (Broader Markets) and should not be used directly as buy or sell signals.
Milan Vaishnav, CMT, MSTA
Consulting Technical Analyst,


