The stock markets once again had a buoyant week as the Indian Headline Index NIFTY50 closed at a fresh lifetime high. The Indian market had four consecutive weeks of gains, piling up over 1121 points and taking a breather after that. However, after pausing its up move for just one week, the markets went on to acquire gains once again over the previous five sessions. The trading range remained nearly the same for this week as well. The weekly high was just 5-odd points short of the Index's lifetime intraday high. After a trading range of nearly 390 points, the benchmark Index NIFTY closed with net gains of 177 points (+1.13%) on a weekly basis.
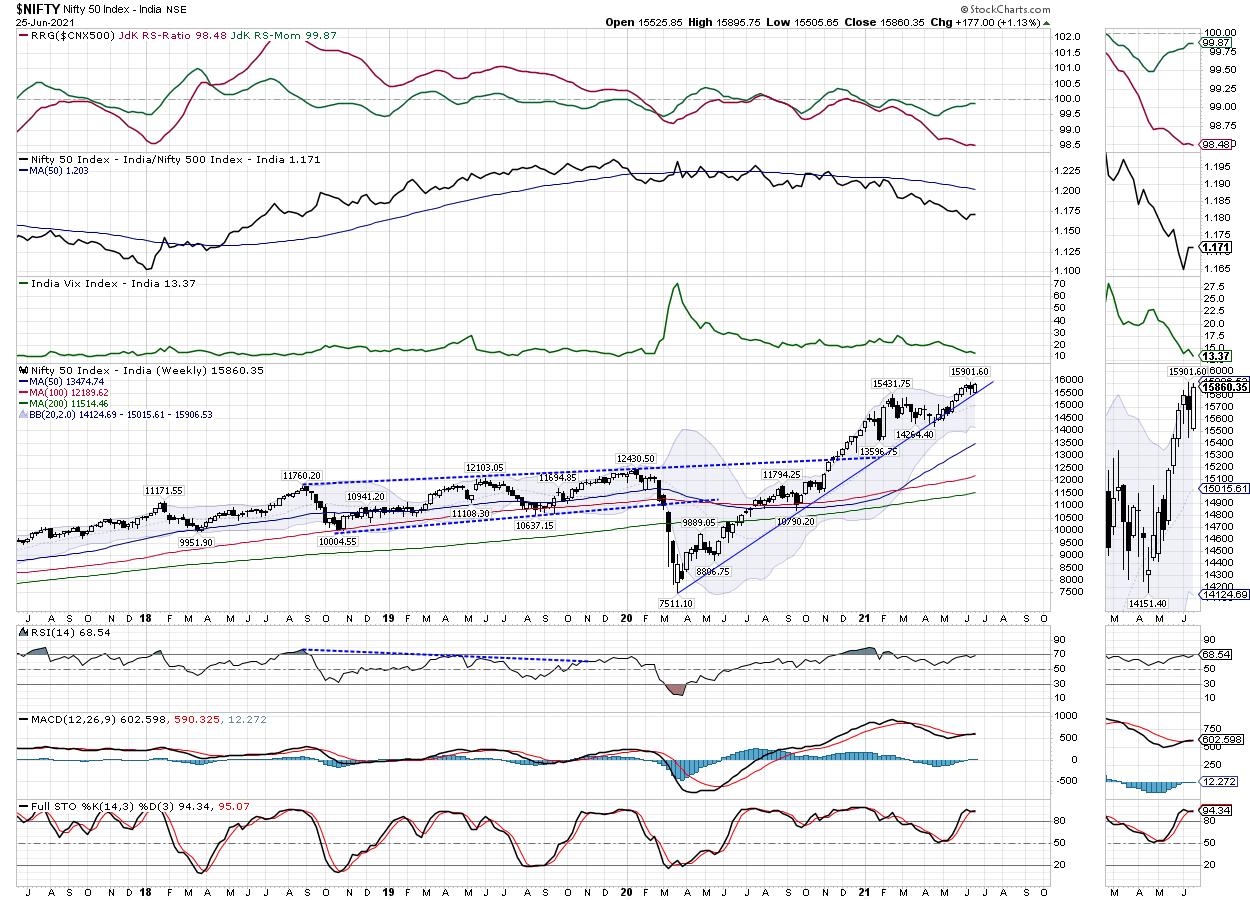
Despite the relentless incremental up moves, the markets, in general, are also showing unending warning signs. The breadth and the internal strength of the markets remain weak. The lead indicators continue to show ongoing bearish divergences against the price. Immediate short-term indicators are still overbought. More concerning is the fact that volatility has once again gone back to its lowest levels, seen only in early 2020; it remains near its lowest levels seen over several years. Volatility saw a sharp decline as the INDIAVIX came off by 9.66% again to 13.37. The Index may continue marking higher points; however, the current technical setup disallows us to be complacent.
The levels of 16000 remain psychologically important for the markets. This point consistently holds maximum Call OI and the pattern analysis also shows the zone of 15850-15900 as major resistance in the immediate short term. The coming week is likely to see the levels of 16000 and 16195 act as resistance levels in the event of any continued move on the upside. The supports come in lower at the 15610 and 15465 levels.
The Relative Strength Index (RSI) on the weekly chart is 68.54; it shows a strong negative divergence against the price. While the NIFTY marked a fresh 14-period high, the RSI did not. This resulted in a bearish divergence. The weekly MACD is bullish; it remains above its signal line. However, from the near-flat histogram, it is evident that the momentum is completely missing.
The examination of the patterns reveals that the NIFTY has taken support for the second week in a row on the rising trend line pattern support. This rising trend line is drawn from the low point seen in March 2020 and this trend line joins the subsequent higher bottoms on the weekly chart.
Although the markets are showing no intent to correct or consolidate, they not moving higher in a healthy manner as well. The prolonged periods of persistently low volatility can inevitably lead to the phases of high volatility. There are all possibilities that, so long as the NIFTY stays below the psychological 16000 levels, it will remain vulnerable to volatile profit-taking bouts at higher levels.
A couple of sentiment indicators that are purely technical in nature provide a hint that a probable top may be coming around for the markets. By saying this, it is important to lay emphasis on the fact that it is practically impossible to catch the last and the highest or lowest point in the markets. However, using technical indicators, one can easily gauge the health of the move. The current technical structure strongly suggests that, though we may not immediately start building aggressive shorts, it is definitely time that we protect our long positions. This is the time when strict trailing of stop-loss levels will help in optimum protection of profits at current and higher levels.
Sector Analysis for the Coming Week
In our look at Relative Rotation Graphs®, we compared various sectors against CNX500 (NIFTY 500 Index), which represents over 95% of the free float market cap of all the stocks listed.
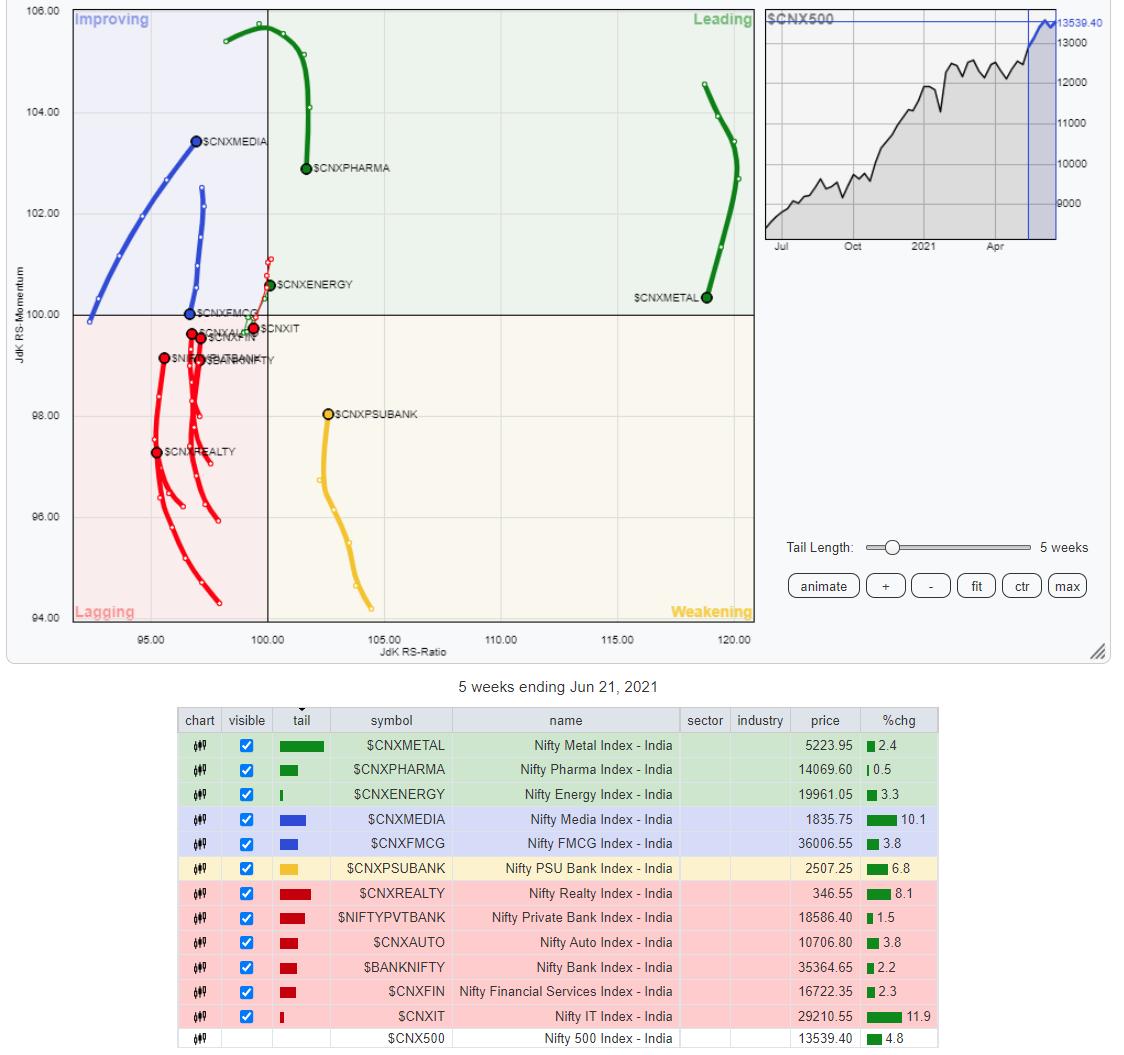
Our review of Relative Rotation Graphs (RRG) shows the risk-on setup in force in the markets. Nearly all economy-facing sectors are showing strong improvement in the relative momentum against the broader NIFTY 500 Index. The Small Cap, Commodities, Metal, and Pharma Indexes are all inside the leading quadrant. However, these groups are showing paring of their relative momentum. Only the NIFTY PSE Index is seen maintaining its relative momentum, along with the Energy Index which has just rolled inside the leading quadrant.
The NIFTY Midcap Index continues to languish inside the weakening quadrant. NIFTY PSU Bank is also inside the weakening quadrant. However, it is showing a strong improvement in its relative momentum.
NIFTY Infrastructure has rolled inside the weakening quadrant. The NIFTY Services Sector, Realty, BankNifty, Financial Services and Auto Indexes are all inside the lagging quadrant. However, they are showing a strong improvement in their relative momentum against the broader markets.
The NIFTY FMCG and the Consumption Index are putting up a weak show; they will soon roll back inside the lagging quadrant. However, at present, they are inside the improving quadrant, but losing their relative momentum sharply. NIFTY Media is firm inside the improving quadrant.
Important Note: RRG™ charts show the relative strength and momentum for a group of stocks. In the above chart, they show relative performance against NIFTY500 Index (Broader Markets) and should not be used directly as buy or sell signals.
Milan Vaishnav, CMT, MSTA
Consulting Technical Analyst,


