The Indian equity markets took a breather in the week gone by as they halted four consecutive weeks of gains. Over the past month, the NIFTY had piled up 1121.55 points of gains. However, over the past five days, the NIFTY retraced after marking its fresh lifetime high at 15901.60. Following numerous signs of classical distribution, the headline index retraced from its top. With the onset of some corrective moves, the trading range also got wider. The NIFTY oscillated in a 450-point range before ending the week with a modest loss of 116 points (-0.73%).
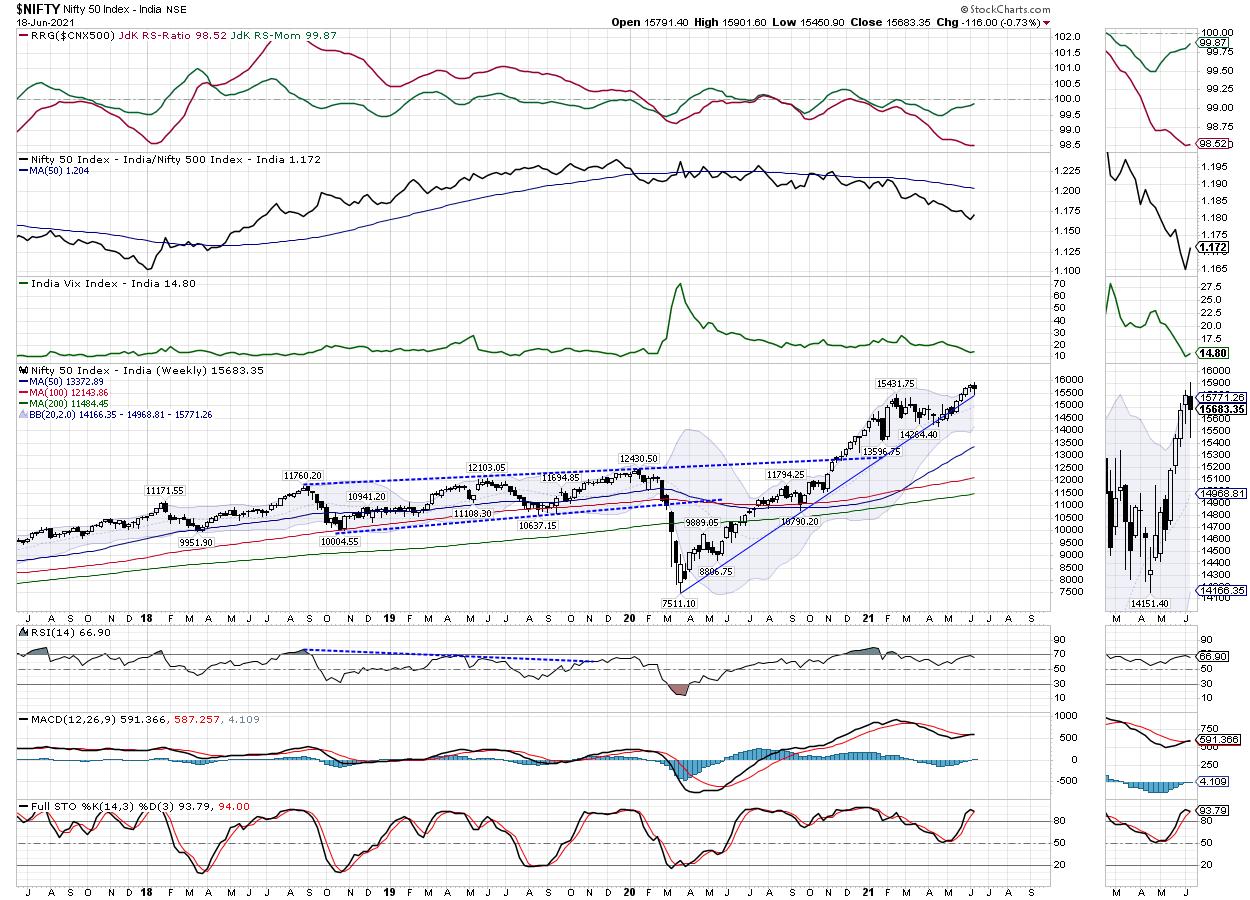
In the previous weekly note, it was mentioned that the only thing that could be potentially harmful to the market would be its own precariously dangerous technical structure. This holds true for this week as well, despite a weekly rise of 4.93% to 14.80 volatility, as shown by INDIAVIX still remaining below 15, the level that was seen only in early 2020. The most recent price action in the NIFTY has seen the Index marking a potential top at 15901.60. Unless the Index moves past this level, it will now remain vulnerable to violent profit-taking bouts from the current as well as higher levels.
In the event of any technical pullback, the coming week will see the Index facing resistance at the 15790 and 15900 levels. On the downside, supports exist much lower at the 15450 and 15300 levels. Any resumed corrective is likely to make the trading range wider.
The weekly RSI is 66.90; it remains neutral and does not show any divergence against the price. The daily MACD is bullish and marginally above the signal line. However, a look at the histogram reveals a visible lack of momentum in the markets. A spinning top occurred on the candles. The emergence of such a candle near the high point holds the potential to disrupt and pause the current up move. This will require confirmation on the next bar.
In the previous week, there were no directly visible bearish signs on the markets; all it was doing was rising, with a weak breadth showing some classical signs of distribution. However, if we look at the pattern analysis, it appears that NIFTY has formed a potential top at 15900; the week's low has seen the Index taking support on the rising trend line pattern support. This trend line is drawn from the lows of March 2020, which joins the subsequent higher bottoms on the weekly chart.
Over the past five sessions, the markets have shown clear signs of fatigue and some corrective intent. Apart from this, from the relative perspective, the volatility continues to remain near its lowest levels of recent months; these levels were seen only in the early part of 2020. Over the coming days, it is very much likely that the NIFTY may see some spikes and an increase in volatility. The prudent approach would be to continue using the technical pullback, if any, to lighten up the positions. Fresh exposures in high beta stocks should be avoided. While continuing to stay highly defensive, a very selective and cautious approach is advised for the coming week.
Sector Analysis for the Coming Week
In our look at Relative Rotation Graphs®, we compared various sectors against CNX500 (NIFTY 500 Index), which represents over 95% of the free float market cap of all the stocks listed.
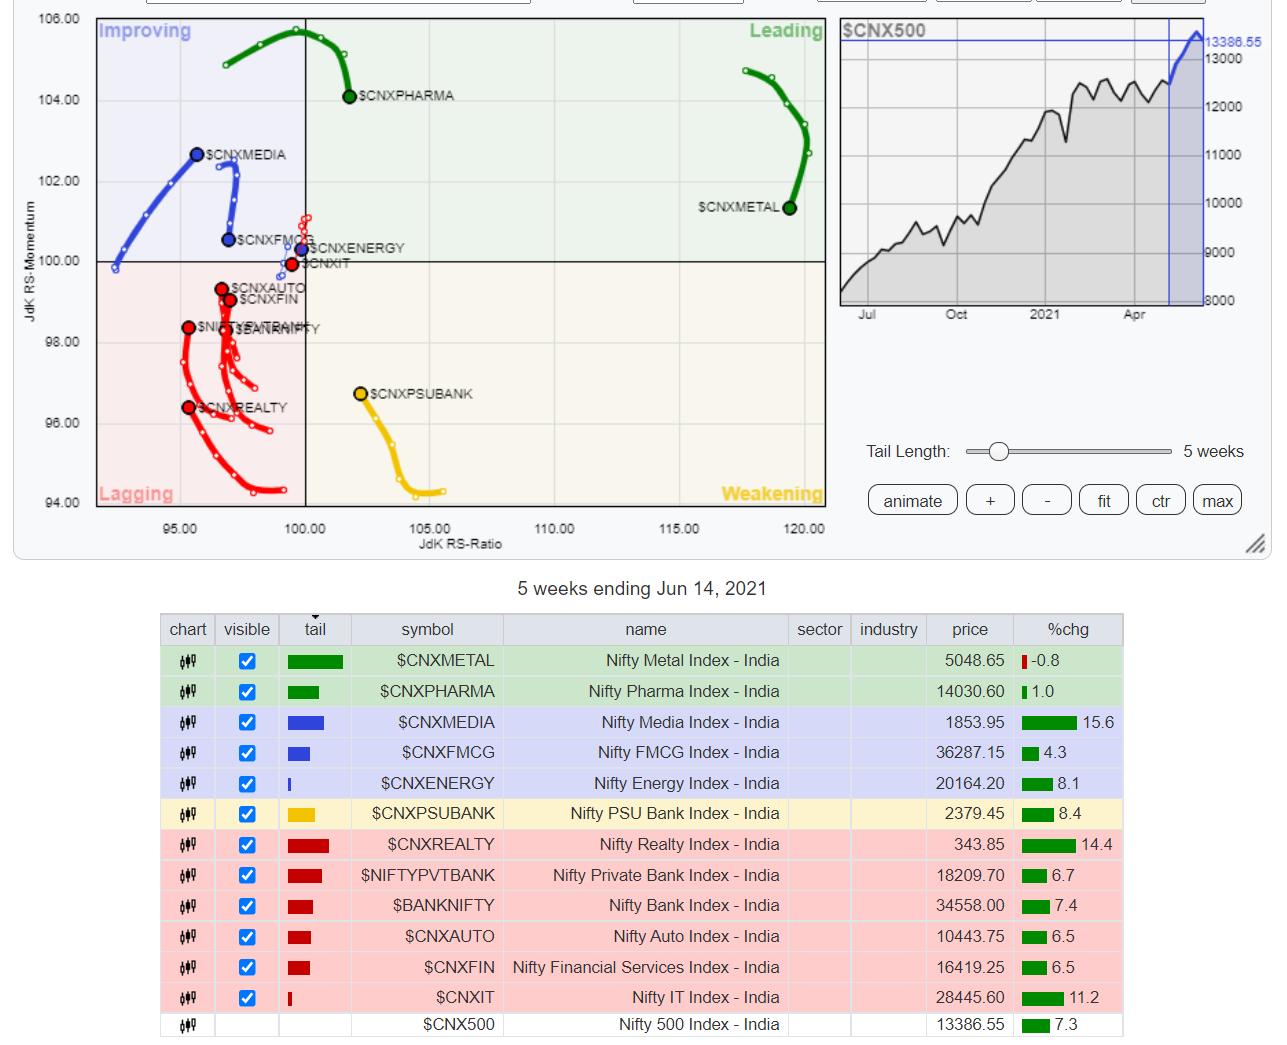
The review of Relative Rotation Graphs (RRG) shows that only the NIFTY PSE Index, which has rolled back inside the leading quadrant, is seen maintaining its relative momentum. Other indexes, like NIFTY Pharma, Metal, and Small Cap index that are in the leading quadrant, are seen paring their relative momentum. However, stock-specific performance from these groups cannot be ruled out.
The NIFTY Infrastructure index is inside the weakening quadrant, along with the NIFTY MIDCAP 100 Index. These groups are slated to relatively underperform the broader markets. The NIFTY PSU Bank Index is also in the lagging quadrant.
The NIFTY IT has slipped inside the lagging quadrant. This may cause this group to relatively underperform the broader NIFTY 500 Index. Just like the previous week, the NIFTY Financial Services, Services, NIFTY Bank, Realty, and NIFTY Auto Indexes are inside the lagging quadrant. However, they are seen consolidating and trying to improve their relative momentum.
The Energy Index has moved inside the improving quadrant and joins the NIFTY Media index, which is firmly placed inside the quadrant. The NIFTY FMCG and Consumption indexes are also inside the improving quadrant; however, they seem to be vertically paring their relative momentum against the broader markets.
Important Note: RRG™ charts show the relative strength and momentum for a group of stocks. In the above Chart, they show relative performance against NIFTY500 Index (Broader Markets) and should not be used directly as buy or sell signals.
Milan Vaishnav, CMT, MSTA
Consulting Technical Analyst,


