While trading on a narrower range, the NIFTY continued its up move and ended on a positive note for the fourth consecutive week. The NIFTY went on to mark its incremental fresh lifetime high as it continued trending higher on reduced and decelerating momentum. The trading range remained narrower at 268 points as against the 359-point trading range in the week before this one. However, while continuing to close at its high point, the NIFTY posted gains of 129.10 points (+0.82%) on a weekly basis. Adding these to the previous three weeks of gains, the NIFTY has gained 1121.55 points over the past four weeks.
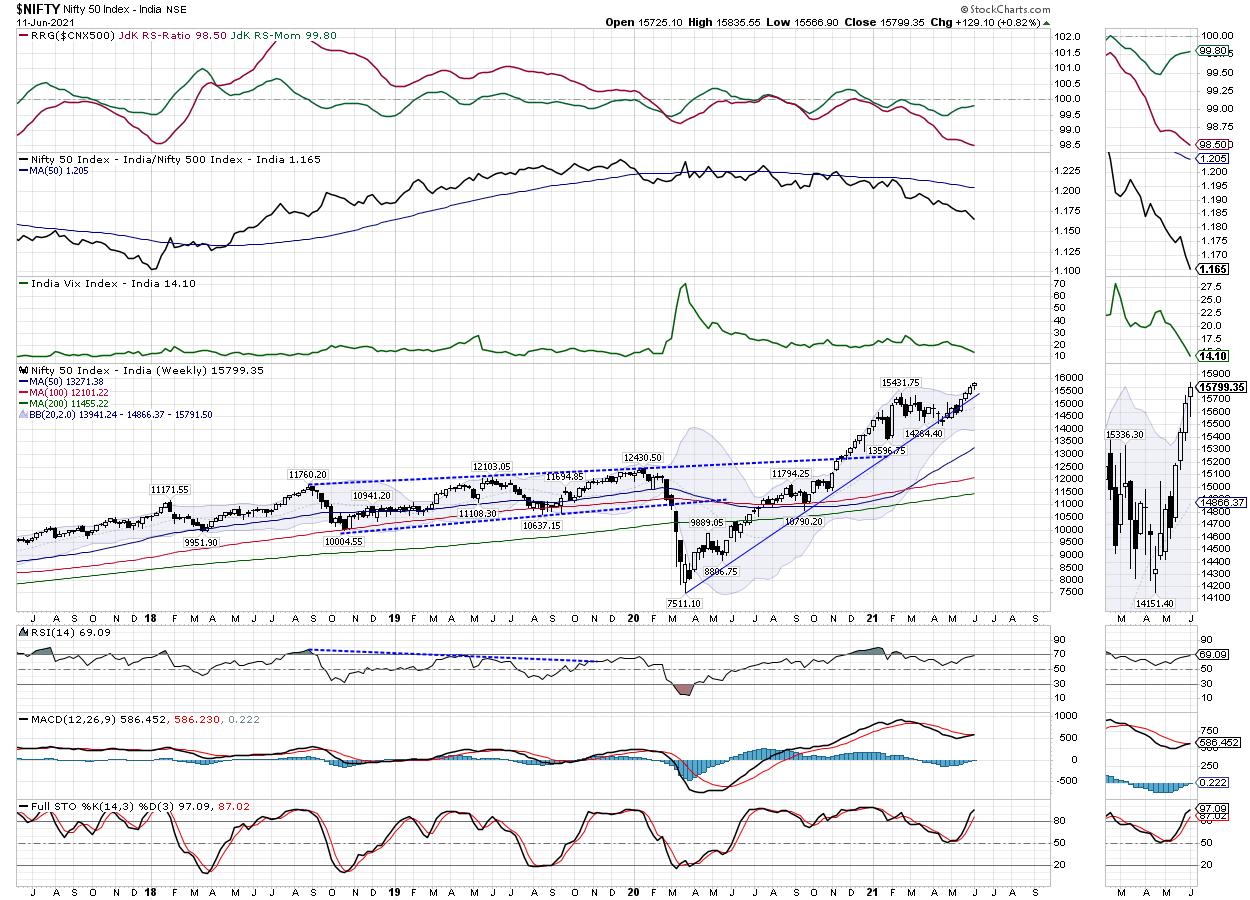
For the coming week, the main thing that will worry the markets will be its own overstretched technical setup; this, when read along with the precariously low VIX values, raises a bright red flag for the immediate short term. Although the setup on the weekly charts looks stable and strong, the NIFTY is a bit overstretched on the daily charts; the momentum is seen decelerating over the past couple of days. The Volatility continued its unabated decline; INDIAVIX came off by another 11.53% to 14.10. The options data suggests that the NIFTY has seen a near-consistent and near-similar call writing at the 15800, 15900 and 16000 levels. This has made another 200-point a very stiff resistance area for the markets.
The coming week is unlikely to see any smooth sailing for the markets. The levels of 15865 and 15945 will act as resistance points. The supports will come in lower at the 15630 and 15500 levels. Any corrective action is likely to make the trading range wider on the downside.
The weekly RSI is 69.09; it has shown a strong bearish divergence against the price. While the NIFTY formed a new 14-period high, the RSI did not, which resulted in the bearish divergence. The weekly MACD has shown a positive crossover; it is now bullish and above the signal line. A candle with a long lower shadow occurred. This exhibits some fatigue at higher levels for the NIFTY.
There are no distinct signs that indicate outright weakness on the charts. The NIFTY is undoubtedly buoyant and trades at its all-time high and in uncharted territory. However, that being said, the VIX remains at its lowest levels of recent time; this indicates a period of low volatility and complacency. Such periods are often followed by spikes in volatility, which leads to high-volatility periods. Such events may cause some measured corrective movements, and, if not, can at least push the markets again in a broad-ranged consolidation.
The markets are moving towards getting highly stock-specific and warrant very efficient risk management by the participants. This is the time when one needs to keep trailing stop-losses, as vigilant protection of profits at current and higher levels assume key importance. We strongly suggest laying emphasis on taking some profits off the table, and trail stop-losses to ensure optimal protection of profits. While remaining highly selective, fresh purchases should be kept at modest levels while continuing to maintain a cautious stance on the markets.
Sectoral Analysis for the Coming Week
In our look at Relative Rotation Graphs®, we compared various sectors against CNX500 (NIFTY 500 Index), which represents over 95% of the free float market cap of all the stocks listed.
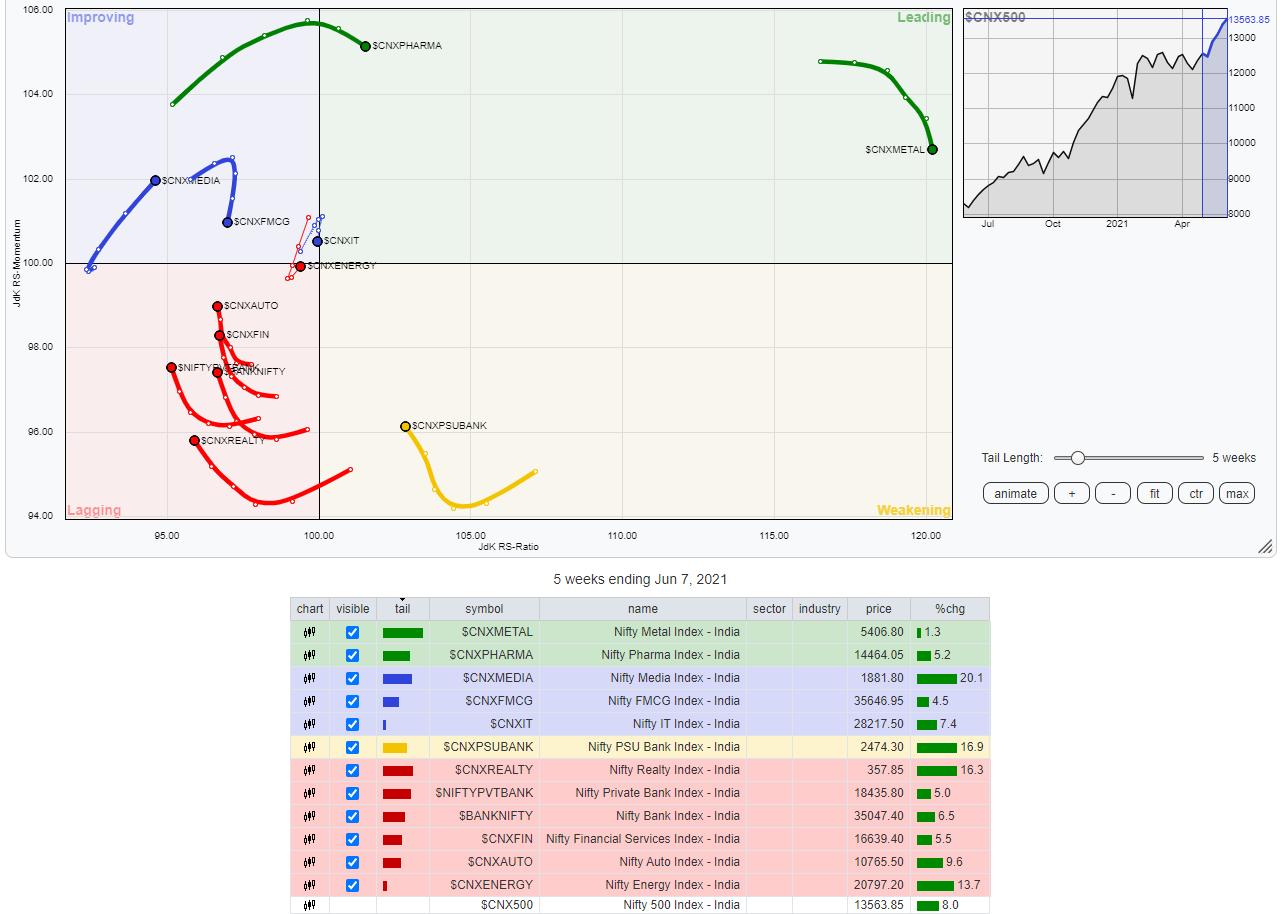
The review of Relative Rotation Graphs (RRG) shows that, although individual performance continued in the metal stocks, NIFTY Metal Index, along with Small-Caps and the Commodities index, is continuing to pare its relative momentum while being placed inside the leading quadrant. NIFTY Pharma is steady inside the leading quadrant; the PSE Index has rotated back inside the leading quadrant. The individual stock-specific relative outperformance can be expected from these groups.
The NIFTY Midcap 100 remains inside the lagging quadrant and so does the NIFTY Infrastructure Index. The PSU Bank index is also inside the lagging quadrant, but is seen attempting to improve its relative momentum against the broader NIFTY500 Index.
The NIFTY Services Sector, Realty and the NIFTY Bank indexes are inside the lagging quadrant. The NIFTY Auto and the NIFTY Financial Services Index are also inside the lagging quadrant; however, they appear to be consolidating and mildly improving their relative momentum. However, barring isolated stock-specific performance, these groups may relatively underperform the broader markets.
NIFTY Consumption and the FMCG indexes are rotating southwest towards the lagging quadrant, though they are presently placed inside the improving quadrant. Similar rotation is also observed in the IT Index. NIFTY Media is placed firmly inside the improving quadrant and appears to be maintaining its relative momentum against the broader markets.
Important Note: RRG™ charts show the relative strength and momentum for a group of stocks. In the above chart, they show relative performance against NIFTY500 Index (Broader Markets) and should not be used directly as buy or sell signals.
Milan Vaishnav, CMT, MSTA
Consulting Technical Analyst,


