Following a buoyant performance in the week before this one, the Indian equities had a quiet show over the past five days. The trading range throughout the previous week was narrower and rested itself on key support. The NIFTY approached its lifetime high point and retraced from that level to close near the low level seen during the week. The trading range remained narrower; the Indian market oscillated in a 279-point range while exhibiting a bearish bias throughout the past several days. The Index finally closed with a net loss of 138.15 points (-0.87%) on a weekly note.
The markets have not only shown classical distribution at higher levels, but also appear to be giving ample signs of a likely corrective more that now look imminent. The NIFTY was unable to take out the 15850-15900 zone despite a few attempts; this has made this zone an intermediate top for the markets. The Options data also shows high Call OI addition at 15800-15900 are making them a formidable resistance area for the markets. The NIFTY has rested itself at a major trend line support. A slip below 15550-15600 area will make the Index weaker.
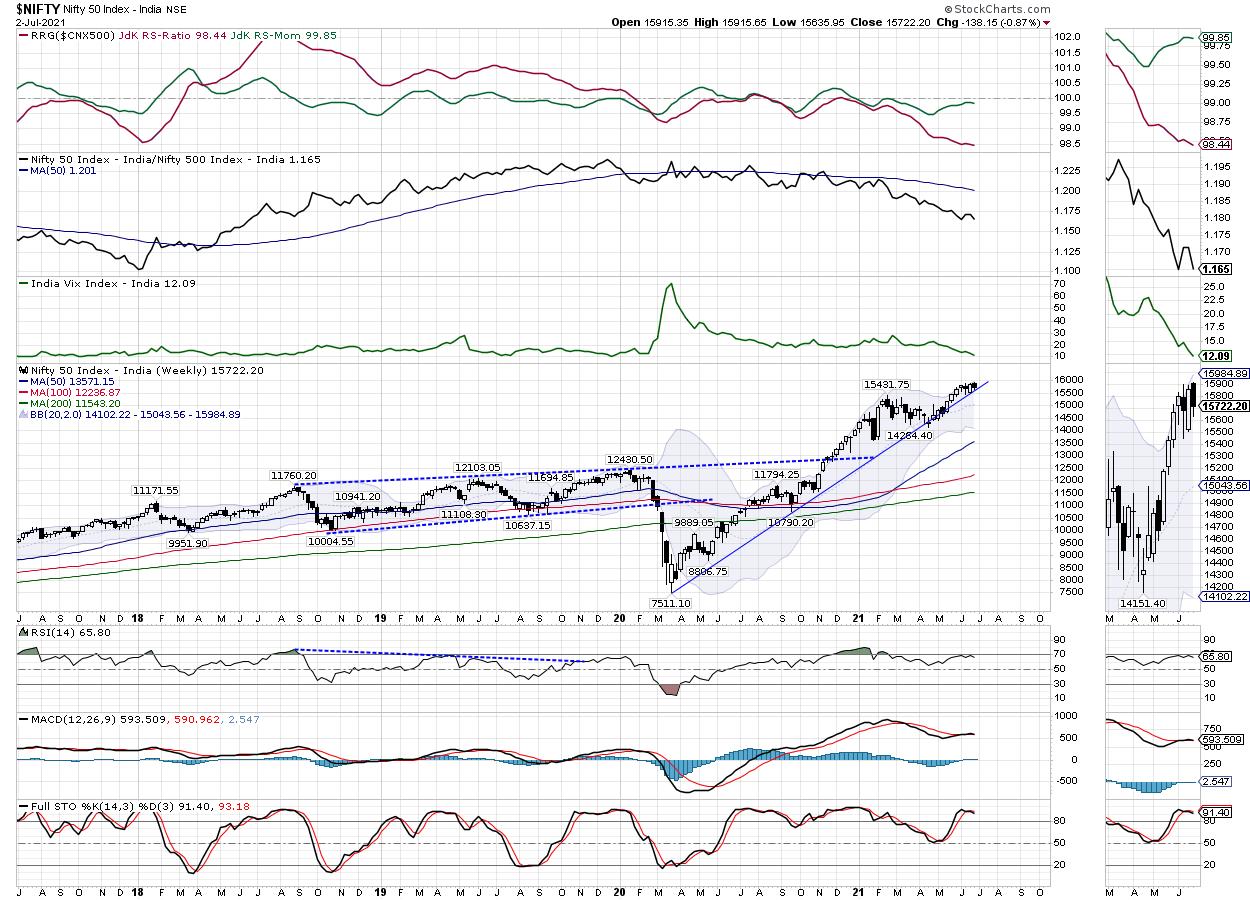
Volatility continued to drift even lower. The INDIAVIX slipped another 9.56% on a weekly basis and is now at 12.09. This level is inarguably near the lowest level seen in the recent past.
The level of 16000, just like the week before this one, remains a psychological resistance for the NIFTY. However, NIFTY will find resistance at levels lower than this at 15850 and 15915. Supports come in at the 15550 and 15430 levels. Any corrective move is likely to make the trading range wider than usual.
The weekly RSI is 65.80; it remains neutral and does not show any divergence against the price. The daily MACD is bullish and above the signal line. However, the near-flat Histogram shows that the momentum is completely lacking in the moves that the NIFTY is making. A black candle appeared. The same level of the opening and the high point of the week shows that the consensus of the market participants stayed negative from the very start of the previous week.
The pattern analysis on the weekly chart shows that the NIFTY has rested itself on a major rising trend line support. This trend line begins from the lows formed in March 2020 and joins the subsequent higher bottoms. Since the NIFTY has tested this important pattern support, any move below this support area will make things worse for the markets.
Although the markets are showing no intent to correct or consolidate, they not moving higher in a healthy manner as well. The prolonged periods of persistently low volatility can inevitably lead to the phases of high volatility. There is a possibility that, so long as the NIFTY stays below the psychological 16000 levels, it will remain vulnerable to volatile profit-taking bouts at higher levels.
Although no major negative moves have been made on the NIFTY as of yet, there are a few technical signs that one cannot afford to ignore. The VIX continues to remain near its lowest levels; prolonged periods of low volatility indicate complacence among market participants, and such a situation often leads to periods of high volatility. The market breadth is also weak and not as healthy as it should be. The strong market breadth and wider participation are required for any meaningful up-move to take place.
All in all, we strongly recommend refraining from creating aggressive long positions. New purchases, if any, should be limited to defensive low beta stocks. While staying light on overall position, we suggest using all up moves, as and when they happen, to protect profits at higher levels.
Sector Analysis for the Coming Week
In our look at Relative Rotation Graphs®, we compared various sectors against CNX500 (NIFTY 500 Index), which represents over 95% of the free float market cap of all the stocks listed.

Our review of Relative Rotation Graphs (RRG) shows that the NIFTY Commodities and NIFTY Metal Index has slipped inside the weakening quadrant, indicating a likely end to their relative outperformance against the broader markets. The NIFTY Pharma, Energy, Small Cap and the PSE Indexes remain inside the leading quadrant. These groups may relatively outperform the broader NIFTY500 Index.
The NIFTY Midcap 100 is still inside the weakening quadrant. PSU Bank Index is also inside the weakening quadrant, but it is seen rapidly improving on its relative improvement.
NIFTY Auto is inside the lagging quadrant. However, it appears to be rotating towards entering the improving quadrant along with the NIFTY Financial Services Index, which is exhibiting similar behavior. Apart from this, the NIFTY IT is also inside the lagging quadrant. NIFTY Bank, Realty, and the Infrastructure Index are also inside the lagging quadrant, but are seen trying to consolidate and improve their relative performance.
The FMCG Index has rolled back inside the lagging quadrant. NIFTY Consumption and Media Indices stay inside the improving quadrant; the Consumption index is seen rapidly paring its relative momentum on lines of the FMCG Index.
Important Note: RRG™ charts show the relative strength and momentum for a group of stocks. In the above chart, they show relative performance against NIFTY500 Index (Broader Markets) and should not be used directly as buy or sell signals.
Milan Vaishnav, CMT, MSTA
Consulting Technical Analyst


