Over the past five days, the Indian equity markets consolidated and traded in the limited range, ending the week with a modest loss. The NIFTY oscillated in the same range as the week before this one; though it ended on a negative note, it has also formed a parallel bar on the charts. The Index had a trading range of 281-odd points throughout the week and slipped from its high point once again to end in the red. This was the second week in a row where the NIFTY faced fierce resistance in the 15850-15900 zone and retraced from that level. The headline index finally closed with a net loss of 32.40 points (-0.21%) on a weekly basis.
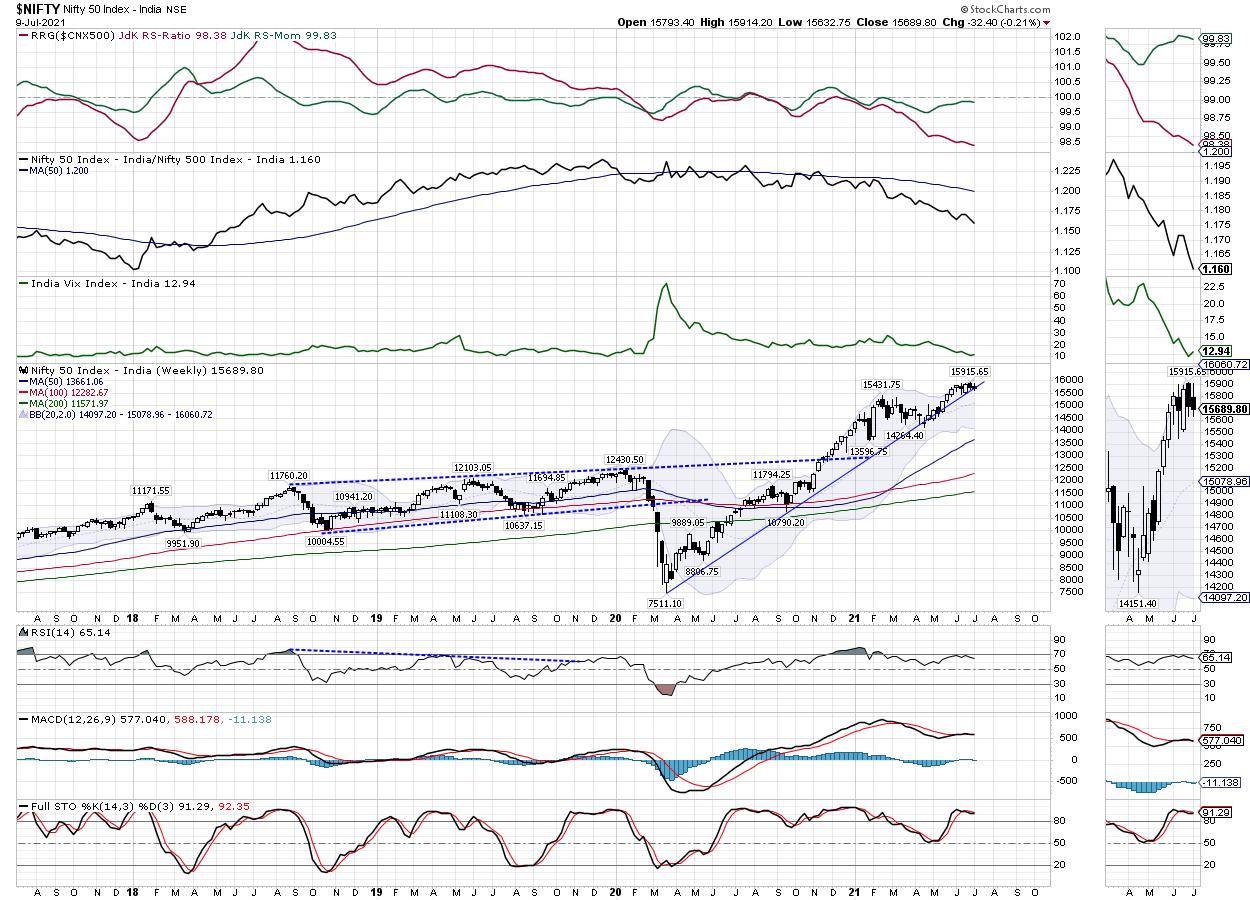
Although the decline on a week-on-week basis was just modest, the current week was mildly damaging for the NIFTY. The Index has slipped and closed slightly below the rising trend line support. This trend line begins from the lows of March 2020 and joins subsequent higher bottoms. So, unless the Index crawls above this pattern support (now a likely resistance) once again, the markets will stay prone to corrective moves. The volatility, as represented by INDIAVIX, saw a spike of 7.05% on a weekly note; it rose to 12.94, which also remains one of the lowest levels seen in the recent past.
The coming week will be tactically important for the markets. The NIFTY will see the levels of 15780 and 15900 acting as resistance points; the supports come in at 15550 and 15400.
The weekly RSI is 65.14; it remains neutral and does not show any divergence against the price. The daily MACD is bullish and above the signal line. However, the Histogram is flat, indicating a total absence of momentum on the upside. No significant formations were observed on the candles.
The pattern analysis shows a modest violation of the important pattern support. This pattern support is in the form of an upward rising trend line that begins from the low point in March 2020 and joins the subsequent higher bottoms. Following a mild violation, the NIFTY may now face resistance from this trend line going forward, unless it manages to crawl back above this.
The market breadth remains internally weak. Also, the internal strength and momentum are missing during all technical pullbacks, which remains a concern. We recommend continuing to track the markets cautiously. It is also suggested that aggressive positions on either side, long or short, should be avoided unless the markets take a directional call from the present stage of consolidation.
Sector Analysis for the Coming Week
In our look at Relative Rotation Graphs®, we compared various sectors against CNX500 (NIFTY 500 Index), which represents over 95% of the free float market cap of all the stocks listed.
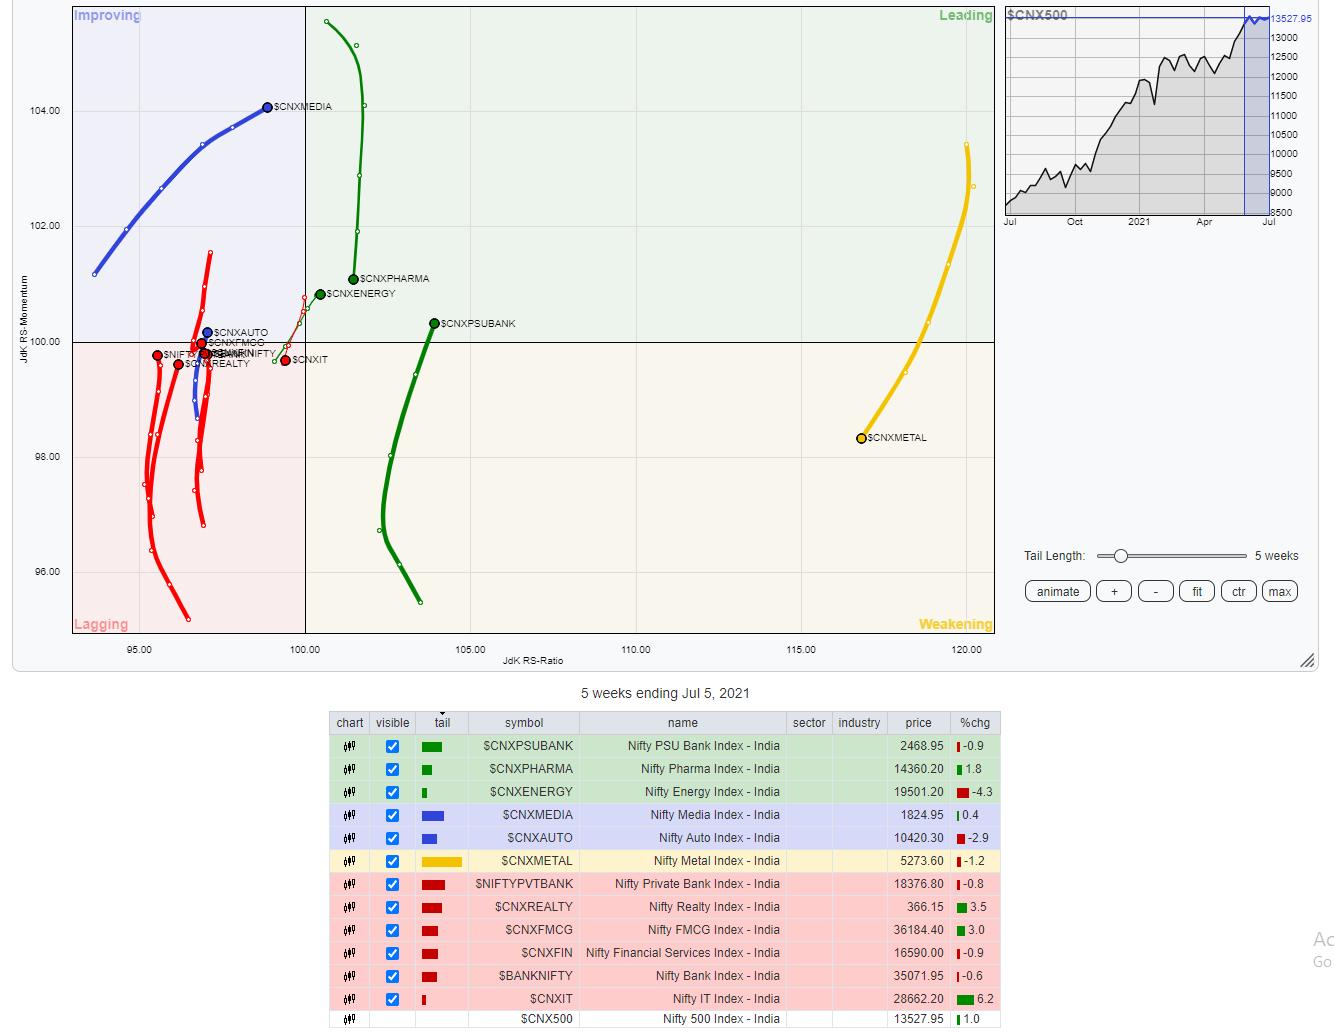
The review of Relative Rotation Graphs (RRG) shows mixed sectoral trends in the markets. On one hand, the high beta sectors are also doing good and, on the other side, the defensive ones like FMCG and Consumption have started to look up once again.
NIFTY Pharma remains in the leading quadrant, but it is continuing to give up on its relative momentum. Besides this, NIFTY PSUBank Index has entered the leading quadrant. NIFTY PSE Index and NIFTY Energy Index are also inside the leading quadrant and may relatively outperform the broader markets.
The Metal Index is inside the weakening quadrant, as is the NIFTY MidCap 100 Index.
The NIFTY Infrastructure index is inside the lagging quadrant and does not appear to be making any major headway. The NIFTY Realty, Services Sector, and NIFTY Bank Indexes are also inside the lagging quadrant; however, they are improving on their relative momentum against the broader markets, along with the NIFTY Financial Services Index.
The NIFTY IT Index is inside the lagging quadrant; however, it is seen attempting to consolidate its performance. The NIFTY FMCG and Consumption indexes that were paring their relative momentum against the broader NIFTY 500 Index over the past many weeks are seen looking up once again. NIFTY Media Index also stays firm inside the improving quadrant.
Important Note: RRG™ charts show the relative strength and momentum for a group of stocks. In the above Chart, they show relative performance against NIFTY500 Index (Broader Markets) and should not be used directly as buy or sell signals.
Milan Vaishnav, CMT, MSTA
Consulting Technical Analyst,


