It was one more consolidating week for the Indian equity markets, as the NIFTY continued to consolidate over the past five days. Despite a couple of attempts, it failed to clear the important resistance zone of 15900-15950 and suffered violent profit-taking twice from those levels. On the short-term daily charts, it has kept its head above crucial closing supports; however, on the weekly chart, it looks evidently weaker. The trading range remained a bit wider; the index oscillated 379 points during the week but did not make any major directional call. The headline index ended with a net loss of 93 points (-0.59%) on a weekly basis.
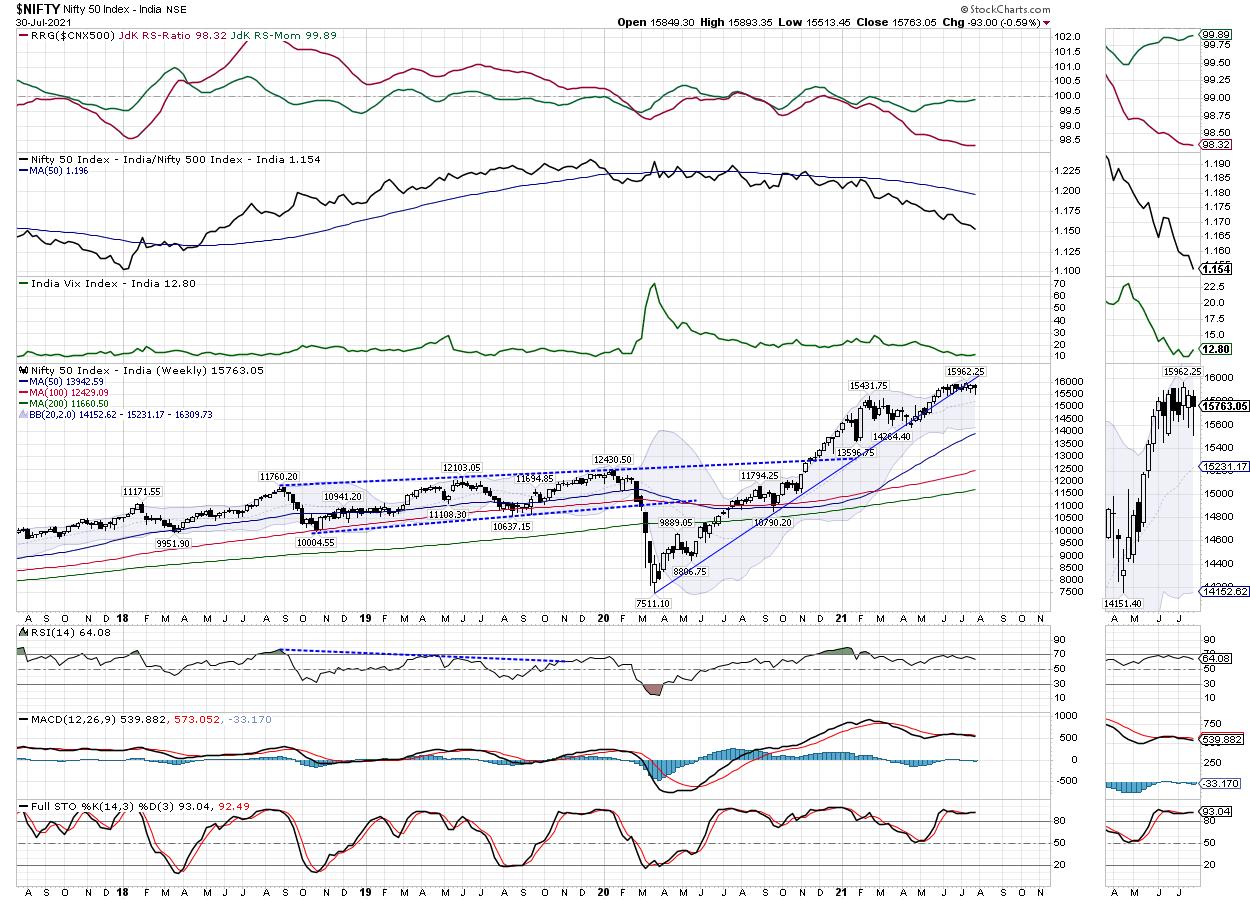
The weekly charts continue to paint a precarious picture for the markets. The NIFTY has continued to resist to the 15900-15950 area; at the same time, it has slipped below the rising trend line support and remains underneath. This trend line is drawn from the lows seen in March 2020 and it joins the subsequent higher bottoms. This was the support for the index earlier; however, it has now slipped, and the line will pose resistance to every up move that the markets may attempt over the coming days. The volatility spiked a bit; the INDIAVIX rose by 8.84% to 12.80 on a weekly note.
In the coming days, we will continue to see the zone of 15900-15950 as a stiff area of resistance for the markets. The support on the lower side exists at 15600 and 15550. The trading range for the market is likely to remain wider than usual for the following week.
The weekly RSI is 64.08; it continues to evidently show bearish divergence against the price. If we subject RSI to regular pattern analysis, it appears that, over the past many weeks when the NIFTY was marking incremental highs, RSI was not making any fresh highs, resulting in a bearish divergence. The weekly MACD is bearish and remains below the signal line. A close examination reveals that the histogram is widening; this implies that the momentum is accelerating on the downside.
A candle with a long lower shadow occurred on the charts. The current candle resembles a classical hanging man, except that it has a small upper shadow. The emergence of such candles just below key resistance zones adds to the credibility of the overhead resistance area.
Overall, the analysis for the coming week remains on similar lines. The NIFTY will face stiff resistance at the 15900-15950 area. Even if the markets manage to inch higher, it will keep facing stiff resistance to the falling trend line support that it has violated. Given the rising nature of the trend line, the longer the NIFTY stays below this pattern resistance, the higher will be the chances of it turning weak. We continue maintaining strict trailing stop-losses while following the momentum on the upside. While continuing to stay highly stock-specific, a defensive approach and vigilant protection of profits on either side is suggested over the coming week.
Sector Analysis for the Coming Week
In our look at Relative Rotation Graphs®, we compared various sectors against CNX500 (NIFTY 500 Index), which represents over 95% of the free float market cap of all the stocks listed.
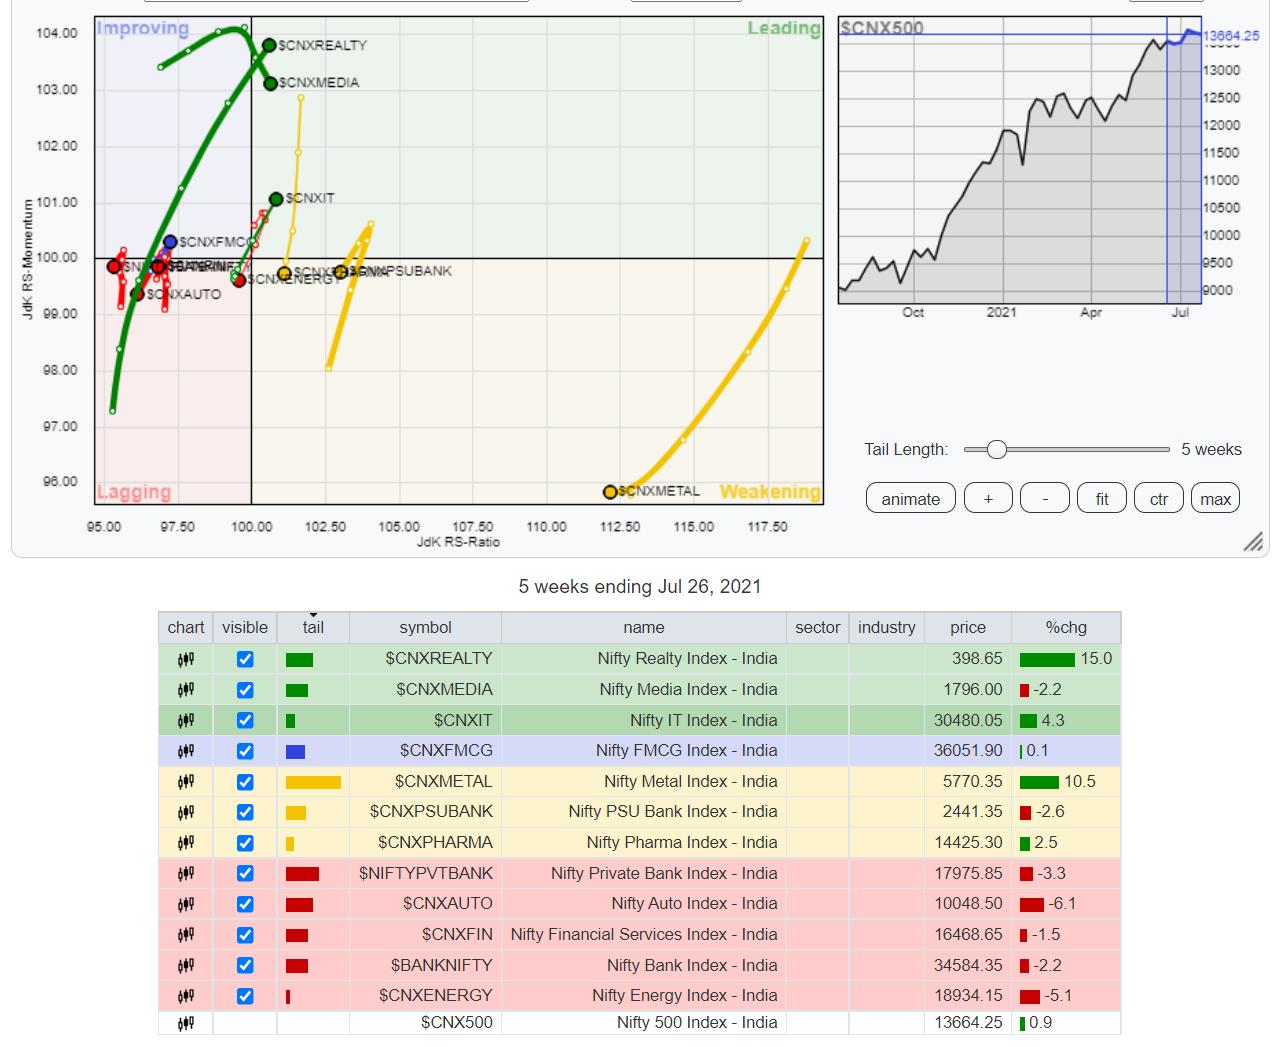
The review of Relative Rotation Graphs (RRG) shows the NIFTY IT Index has made a strong rollover inside the leading quadrant. It is likely to relatively outperform the broader markets, along with NIFTY Realty, which is also firmly placed inside the leading quadrant. The Media Index is also inside the leading quadrant, along with the Small Cap Index.
The NIFTY Commodities and Metal Indexes are placed inside the weakening quadrant. NIFTY, NIFTY Pharma, PSE Index and the PSU Bank Indexes have also rolled inside the weakening quadrant. This means that we will see reduced relative outperformance from these groups against the broader markets.
NIFTY Energy and BankNIFTY have rolled inside the lagging quadrant. NIFTY Auto, Financial Services, Services Sector and the Infrastructure indices also appear to be languishing inside the lagging quadrant.
FMCG and Consumption have rolled inside the improving quadrant and are expected to relatively outperform the broader markets.
Important Note: RRG™ charts show the relative strength and momentum for a group of stocks. In the above Chart, they show relative performance against NIFTY500 Index (Broader Markets) and should not be used directly as buy or sell signals.
Milan Vaishnav, CMT, MSTA
Consulting Technical Analyst
www.EquityResearch.asia | www.ChartWizard.ae


