The Indian equities showed a lot of resilience throughout the past five trading days and managed to close on a fresh weekly near its fresh all-time high point. The markets stayed resilient to the downsides, but, at the same time, showed fierce consolidation at higher levels and did not make any meaningful move on the upside as well. The week saw a trading range of 317.50 points; NIFTY oscillated in this range, which was quite similar to the trading ranges witnessed over the past couple of weeks. Broadly speaking, the week was spent in consolidation, with a clean and clear breakout still being awaited. The headline Index ended with net weekly gains of 233.60 points (+1.49%).
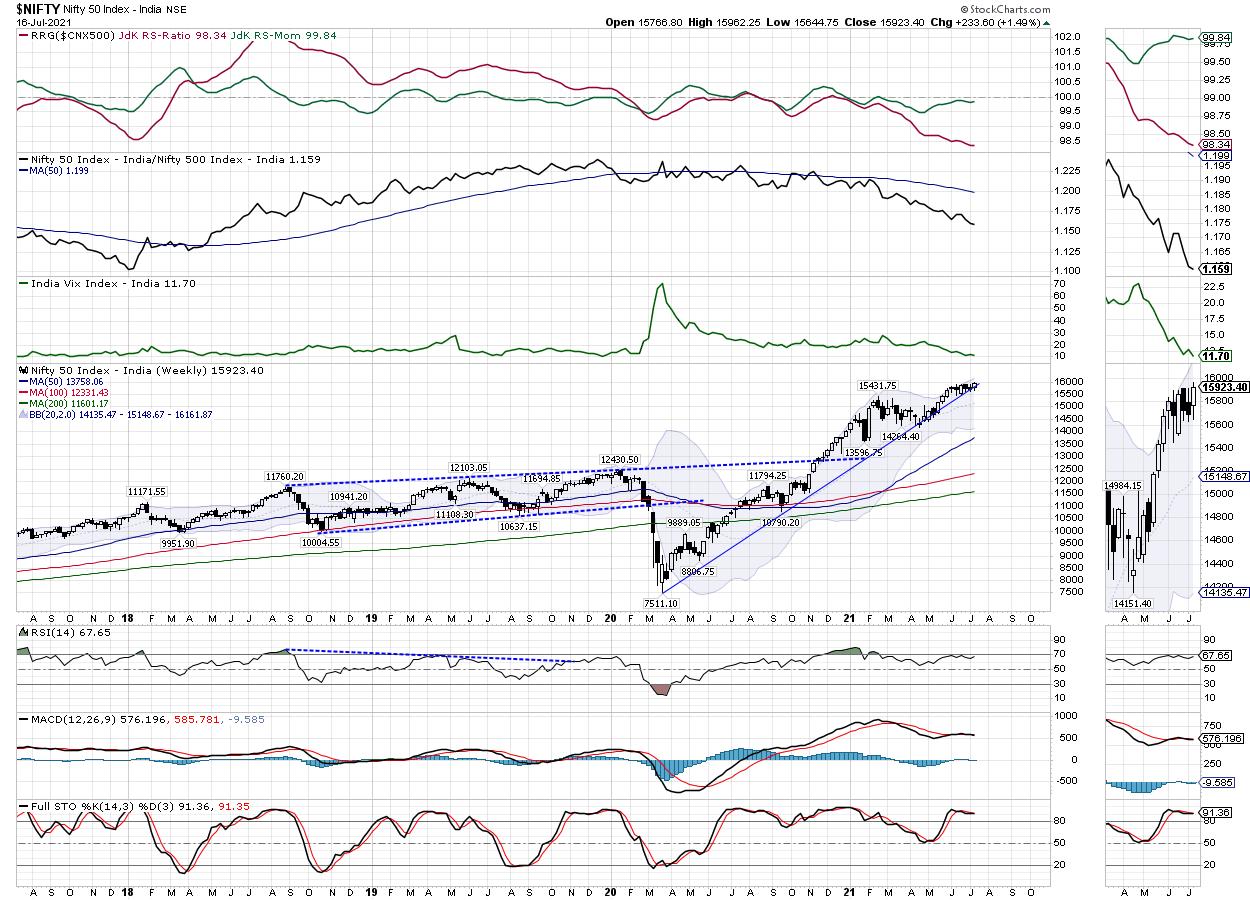
The coming week is a truncated week, with July 21st being a trading holiday on account of Bakri ID. The broader markets are seeing a strong outperformance against the frontline NIFTY. The RS line of NIFTY against the broader NIFTY500 is under secular decline and below its 50-DMA. Besides this, the clear breakout in NIFTY50 is still being awaited, which will come when the NIFTY moves past 15900 and closes meaningfully above that. The volatility continues to remain a concern. INDIAVIX plunged to one of its lowest points seen in recent past; it declined another 9.56% to 11.70 on a weekly basis.
In the coming 4-day trading week, the levels of 16000 and 16190 will act as immediate resistance levels. The supports come in at 15850 and 15600 levels.
The weekly RSI is 67.65; it shows a strong bearish divergence against the price. While the NIFTY marked a fresh 14-period high, the RSI did not, which resulted in a bearish divergence. The weekly MACD has shown a positive crossover; it is bearish and trades below the signal line. Apart from a while body that occurred on the candles, no other important formation was seen.
The pattern analysis shows that the NIFTY is clinging to a major support trend line. This trend line begins from the low point seen in March 2020 and joins the subsequent higher bottoms. Given the rising nature of this trend line, the longer the NIFTY stays below the 16000 levels, the more vulnerable it will remain to probable profit-taking bouts at current levels and ending up violating this important pattern support.
All in all, even if the NIFTY has marked an incremental high at 15962, it is yet to give any comprehensive breakout from the previous high of 15915. There are no reasons to suggest any negative development on the charts. However, if we look at a holistic picture, with the markets deliberating near the high point for a long time with precariously low VIX levels, the breakout is something that should not be taken for granted. We recommend sticking to stocks and sectors with strong Relative Strength against the broader markets. Continue to adopt a mindful and alert approach while following the current trend over the coming days.
Sector Analysis for the Coming Week
In our look at Relative Rotation Graphs®, we compared various sectors against CNX500 (NIFTY 500 Index), which represents over 95% of the free float market cap of all the stocks listed.
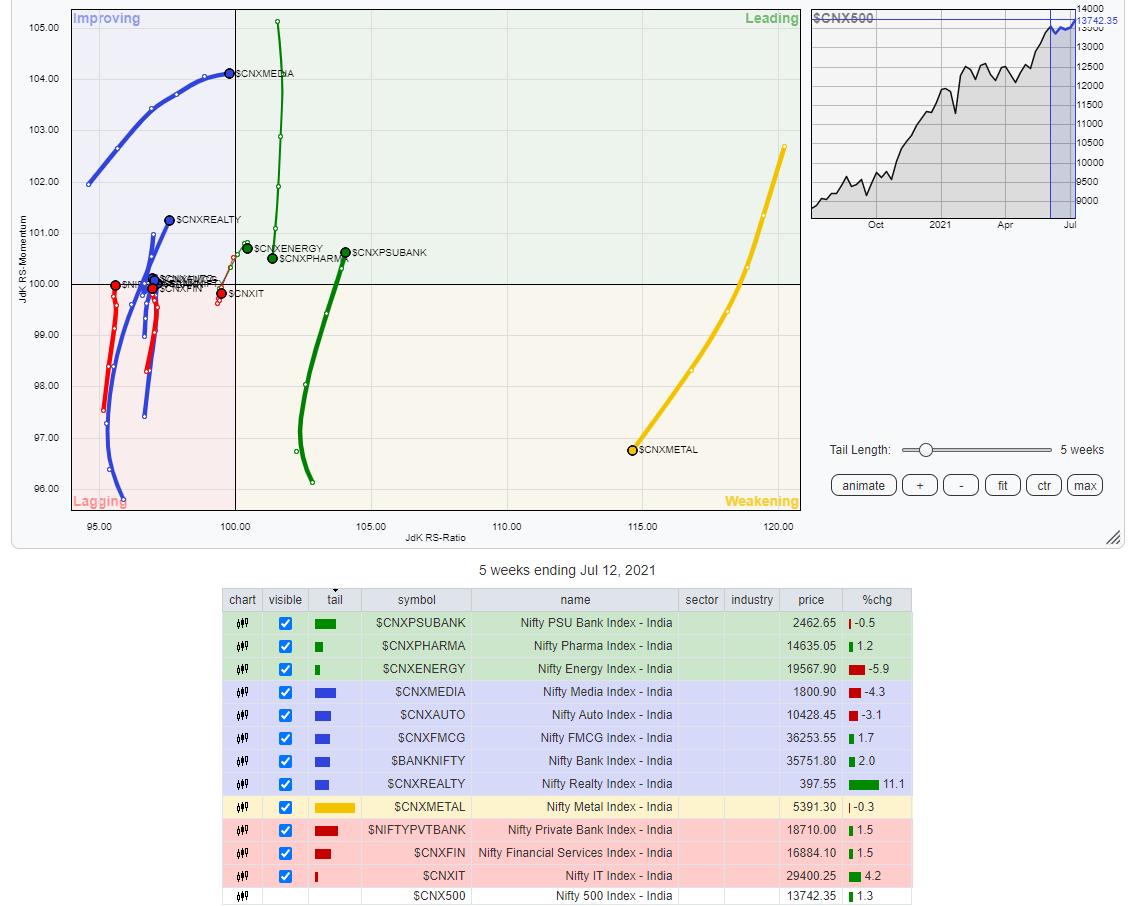
The review of Relative Rotation Graphs (RRG) shows an absence of any clear leadership among sectors. The PSU Bank Index is the only Index that has rolled inside the leading quadrant and shows a steady relative momentum against the broader markets. Apart from this, the NIFTY Energy, Pharma, PSE and Small Cap Indexes are inside the leading quadrant. However, they all appear to be losing their relative momentum.
The NIFTY Midcap Index is seen improving its relative momentum and seen inching towards the leading quadrant. It is presently placed inside the weakening quadrant. The NIFTY Commodities and the Metal indices are also placed inside the weakening quadrant.
The lagging quadrant has NIFTY Infrastructure, NIFTY Bank, Services Sector and Financial Services sector inside it. However, they all seem to be consolidating their performance and their relative momentum against the broader markets.
The NIFTY Realty Index has seen a strong rotation inside the improving quadrant, hinting at a likely end to its relative underperformance against the broader markets. Along with that, the NIFTY Consumption, FMCG and Media Indices are placed inside the improving quadrant.
Important Note: RRG™ charts show the relative strength and momentum for a group of stocks. In the above Chart, they show relative performance against NIFTY500 Index (Broader Markets) and should not be used directly as buy or sell signals.
Milan Vaishnav, CMT, MSTA
Consulting Technical Analyst,


