In the early weekly note, it was mentioned that the following eight weeks of consolidation, the NIFTY has finally staged a breakout while dragging its support levels considerably higher. Over the past five days, the NIFTY extended its gains while it closed at yet another lifetime high levels. The trading range, though, was relatively narrow as the NIFTY consolidated fiercely in the first half of the trading week. It eventually resumed its up move and extended its gains. The markets closed with NIFTY posting net gains of 290.90 points (+1.79%) on a weekly basis.
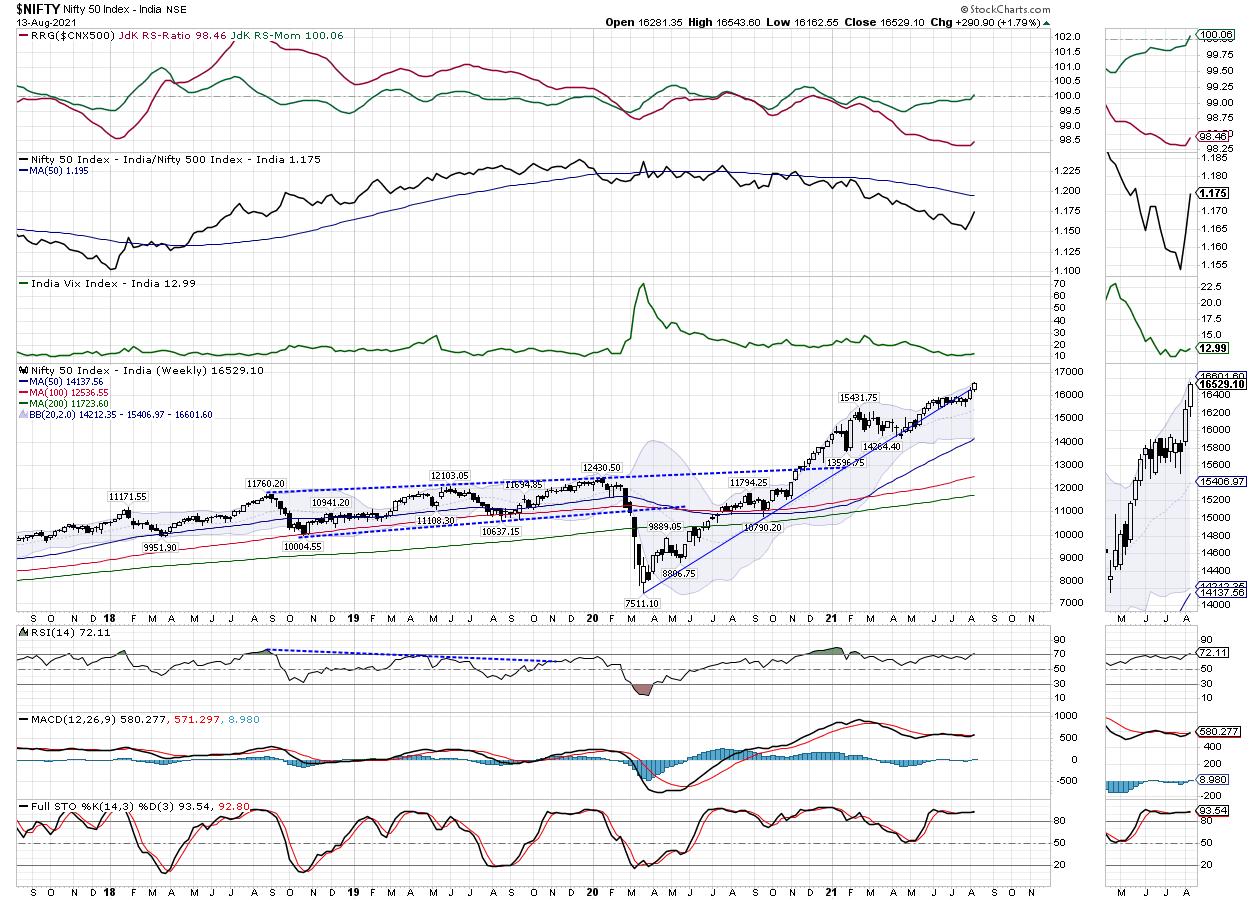
It is beyond doubt that the NIFTY has not only shown a strong breakout, but it has also extended its gains after a strong intermediate consolidation. Going ahead from here, there are higher chances that the NIFTY protects its gains and once again consolidates in a defined range with a positive bias. Meanwhile, it is also the time when the sectors that have underperformed, will try, and play a catchup. These includes BANKNIFTY, FMCG, Consumption and IT index along with other stock-specific shows that cannot be ruled out. The volatility increased a bit; INDIAVIX rose 3.03% to 12.99.
The coming week is likely to see the markets attempting to inch higher. If the NIFTY is able to keep its head above 16500, it is very much likely to extend its up move. On the other hand, a slip below 16500 will cause the markets to undergo defined and range consolidation once again. The levels of 16590 and 16700 will act as potential resistance points; the supports will come in at 16300 an 16210.
The weekly RSI is 72.11; it has marked a new 14-period high which is bullish. RSI is mildly overbought; however, it remains neutral and does not show any divergence against the price. The weekly MACD is bullish and remains above its signal line. A strong white body emerged on the candles. It shows directional consensus among the market participants.
The pattern analysis shows that the NIFTY has not only crawled above the rising trend line support that it had violated, but it has managed to stage a clean breakout. In the process, it has dragged its support levels higher at 16000 levels. Any negative move or a broad consolidation will see this level playing out as a major support in the immediate near term.
The analysis for the coming week remains on similar lines just like the week before this one. The markets are now in uncharted territory; it would be prudent to continue following the up-moves with strict trailing stop-losses in place to protect profits at higher levels. The sectors that need to perform if the markets are to sustain gains will start playing the catchup as mentioned earlier. We recommend focusing more on the large caps as the broader markets are likely to relatively underperform the front line NIFTY. A cautiously positive outlook is advised for the coming week.
Sector Analysis for the coming week
In our look at Relative Rotation Graphs®, we compared various sectors against CNX500 (NIFTY 500 Index), which represents over 95% of the free float market cap of all the stocks listed.
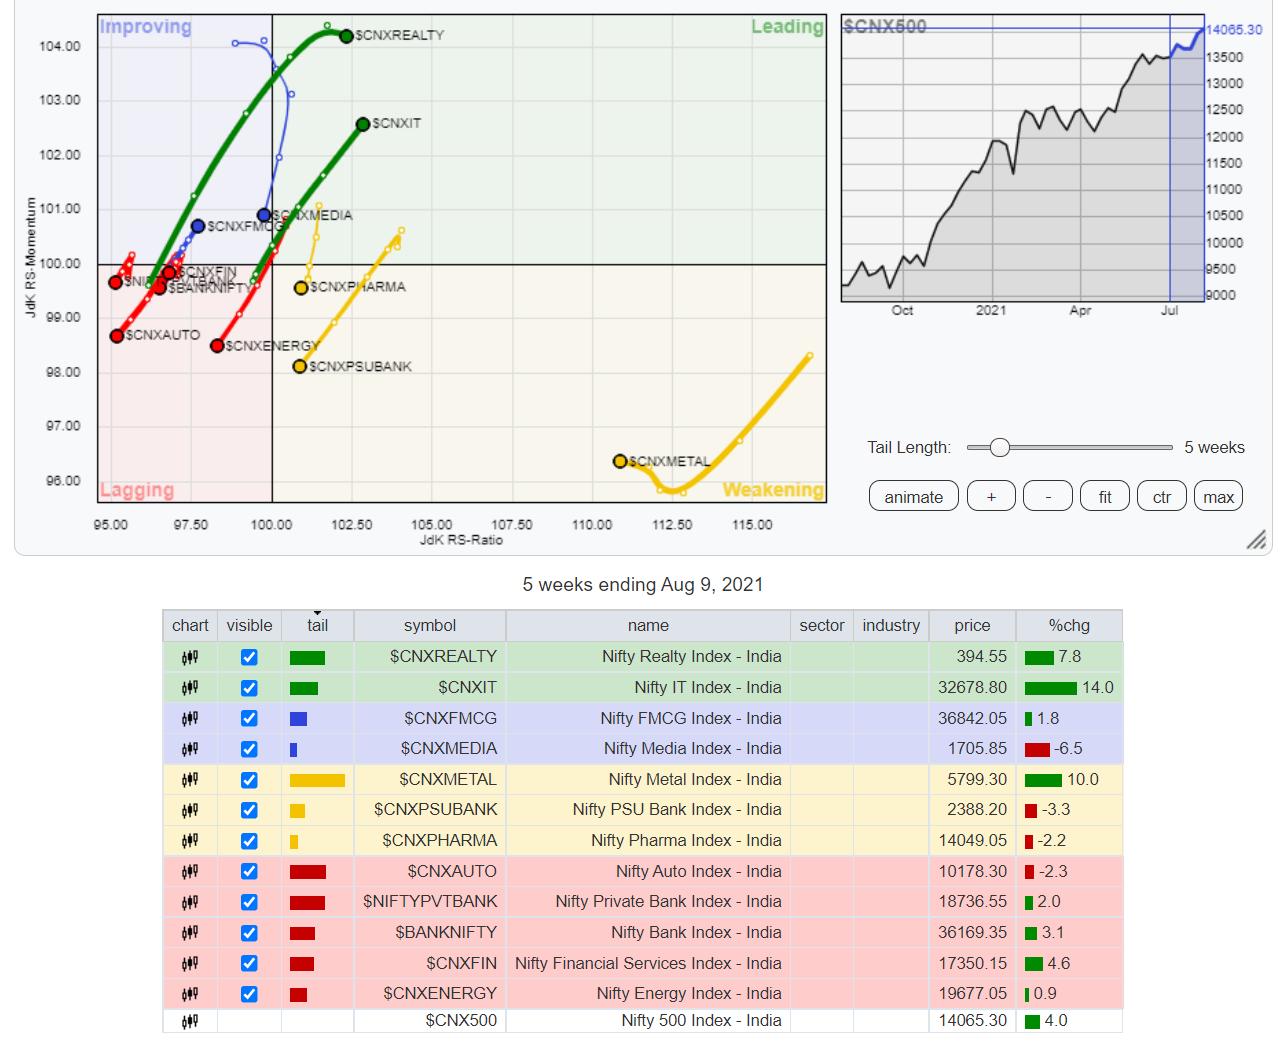
The analysis of Relative Rotation Graphs (RRG) shows that NIFTY Realty and IT Indexes are the two most dominant groups in the leading quadrant. These indexes and its constituents will continue to relatively underperform the broader NIFTY500 index. Small Cap Index is also seen inside the leading quadrant; however, it appears to be paring its relative momentum.
NIFTY Midcaps, Metals, Commodities, PSE, and PSU Banks Indexes are inside the weakening quadrant. They are unlikely to put up any major show except some few stock-specific moves.
NIFTY Auto and Energy Indexes continue to languish inside the lagging quadrant. There are greater chances of relative under performance from these groups. Banknifty and NIFTY Infrastructure Index is also inside the lagging quadrant.
FMCG, Consumption, and NIFTY Services sector Indexes are inside the improving quadrant.
Important Note: RRG™ charts show the relative strength and momentum for a group of stocks. In the above Chart, they show relative performance against NIFTY500 Index (Broader Markets) and should not be used directly as buy or sell signals.
Milan Vaishnav, CMT, MSTA
Consulting Technical Analyst
www.EquityResearch.asia | www.ChartWizard.ae
· For Premium Equity Portfolio Advisory on Indian Stocks, Click Here
· Alpha-generating actionable investment ideas on the US and UK Equities Click Here
· For International Commodities like Gold, Crude Oil and EURUSD/GBPUSD pairs Click Here


