In the previous weekly note, we had mentioned that the only trouble with the otherwise buoyant NIFTY is that it is overextended on the daily chart. The week that went by saw the markets consolidating at higher levels. On the global landscape, the "taper tantrums" from the Fed saw some volatile reactions from the global markets. The Indian equity markets stayed very much resilient as compared to its global peers. They have managed to protect their key levels while consolidating in a defined range. Following the last two days of corrective moves, the NIFTY has ended with a net loss of 78.60 points (-0.48%) on a weekly basis.
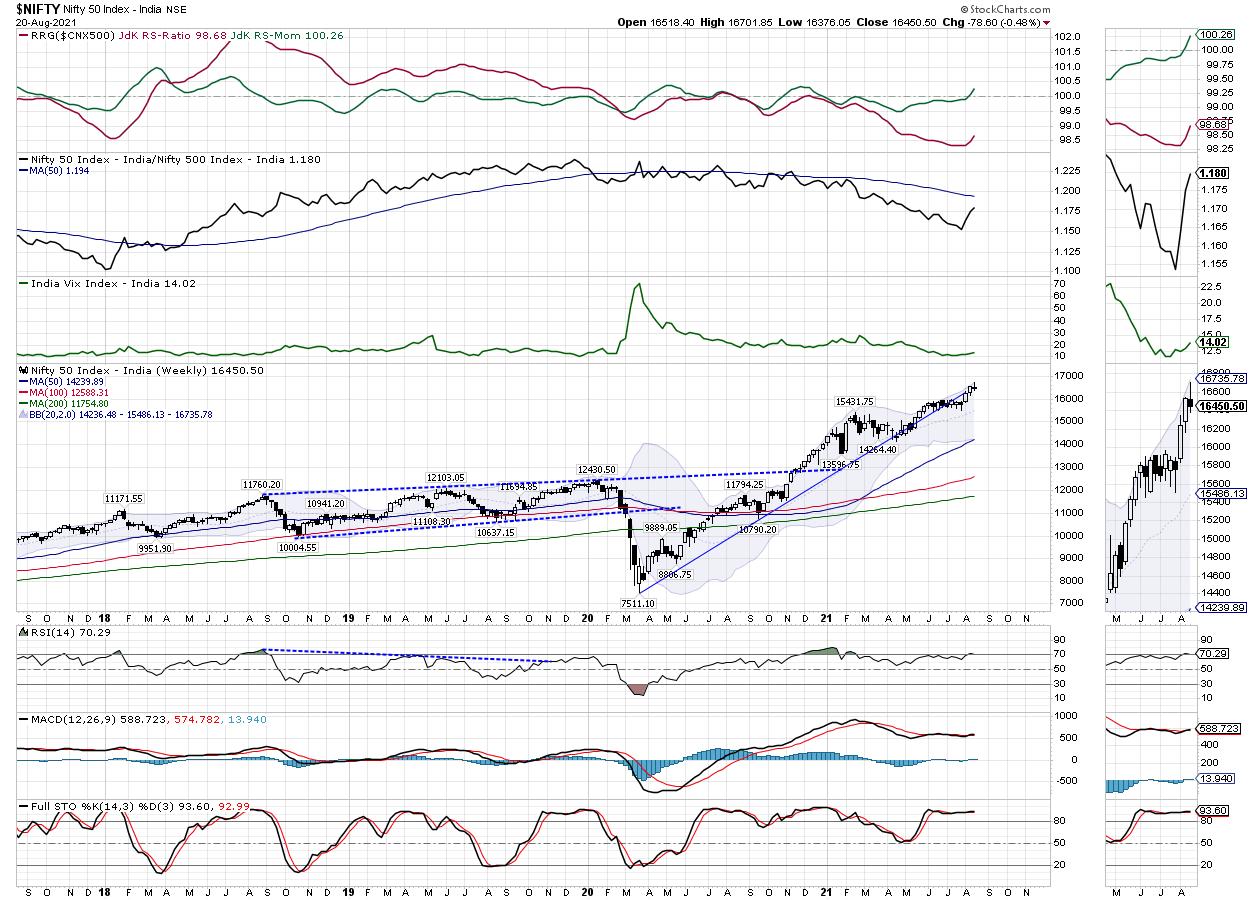
At the beginning of the week, the NIFTY had become overbought on the daily charts; the PCR across all expiries had reached close to 1.80. The overextended nature of the otherwise buoyant needed one healthy corrective move; we saw that coming in the second half of the previous week. Given the strength of the US Dollar Index, the metal stocks took a hit. However, the key sectors and stocks that were expected to play catch up continued to remain laggards. The volatility increased; INDIAVIX rose by 7.89% to 14.02 on a weekly note. Over the coming days, it would be crucial for the Index to defend the 16300-16450 levels to avoid any major corrective move.
The coming week will see the levels of 16600 and 16730 playing out as likely resistance points. The supports will come in at 16350 and 16220 levels.
The weekly RSI is 70.29; it remains in the mildly overbought zone. RSI, however, is still neutral and does not show any divergence against the price. The weekly MACD is bullish; it remains above the signal line.
The weekly RSI is 72.11; it has marked a new 14-period high, which is bullish. RSI is mildly overbought; however, it remains neutral and does not show any divergence against the price. The weekly MACD is bullish and remains above its signal line. A strong white body emerged on the candles. It shows directional consensus among the market participants. A spinning top occurred on the Candles.
The pattern analysis shows that the breakout that occurred on the daily charts above 15900-15950 levels is still valid and very much in action. The examination of the weekly chart shows that the Index has continued with its up move following eight weeks of sideways consolidation. It remains above the pattern support trend line drawn from the lows formed in March 2020.
The US Dollar Index has resumed its up move after some ranged consolidation. The strengthening of the US Dollar Index is a negative for commodity prices. In the coming week, we recommend using all the up moves in the metal stocks to book profits and take money off the table. The defensive sectors like FMCG, Consumption and IT are likely to show resilience. It is also expected that the BANKNIFTY, which has been a laggard, may attempt to correct its relative underperformance. In any case, it is suggested to avoid shorts, make purchases selectively and vigilantly protect profits at higher levels.
Sector Analysis for the Coming Week
In our look at Relative Rotation Graphs®, we compared various sectors against CNX500 (NIFTY 500 Index), which represents over 95% of the free float market cap of all the stocks listed.
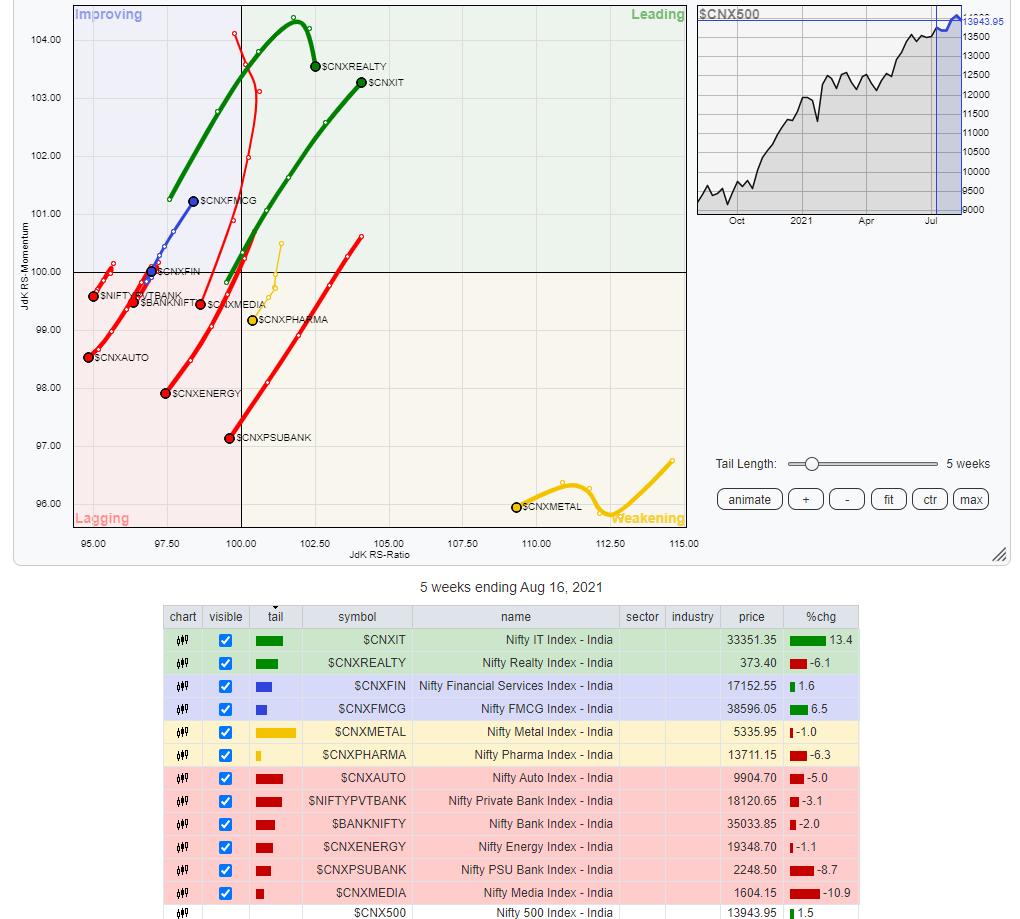
The analysis of Relative Rotation Graphs (RRG) shows that, despite the lackluster performance, the REALTY Index remains inside the leading quadrant, though it appears to be slightly paring its relative momentum and consolidating like the small-cap index. The NIFTY IT Index remains in the leading quadrant; it appears to be firmly maintaining its relative momentum against the broader NIFTY500 index. This group is set to relatively outperform the benchmark.
The NIFTY Metal, Pharma, and PSE Indexes are inside the weakening quadrant, along with Commodities and the Midcaps.
PSU Bank Index has rolled inside the lagging quadrant, as has the Media Index. NIFTY Bank, Auto and the Energy Indexes also remain inside the lagging quadrant.
The NIFTY Services Sector index is inside the improving quadrant, along with the NIFTY FMCG and the Consumption Index. These groups are likely to show resilient performance against the broader markets.
Important Note: RRG™ charts show the relative strength and momentum for a group of stocks. In the above Chart, they show relative performance against NIFTY500 Index (Broader Markets) and should not be used directly as buy or sell signals.
Milan Vaishnav, CMT, MSTA
Consulting Technical Analyst
www.EquityResearch.asia | www.ChartWizard.ae
· For Premium Equity Portfolio Advisory on Indian Stocks, Click Here
· Alpha-generating actionable investment ideas on the US and UK Equities, Click Here
· For International Commodities like Gold, Crude Oil and EURUSD/GBPUSD pairs, Click Here


