As discussed in an earlier technical note, the Indian equity markets were grossly overbought; as a result, they were largely expected to consolidate. However, in the first four days of the week, the NIFTY put up a very strong show as it kept marking incremental lifetime highs on a closing basis. The last trading session of the week also had a buoyant first half; however, the second half of the session saw some serious paring of gains. The NIFTY traded in a much wider 523.80-points range. Despite coming off its high, it managed to end with a net gain of 215.90 points (+1.24%) on a weekly basis.
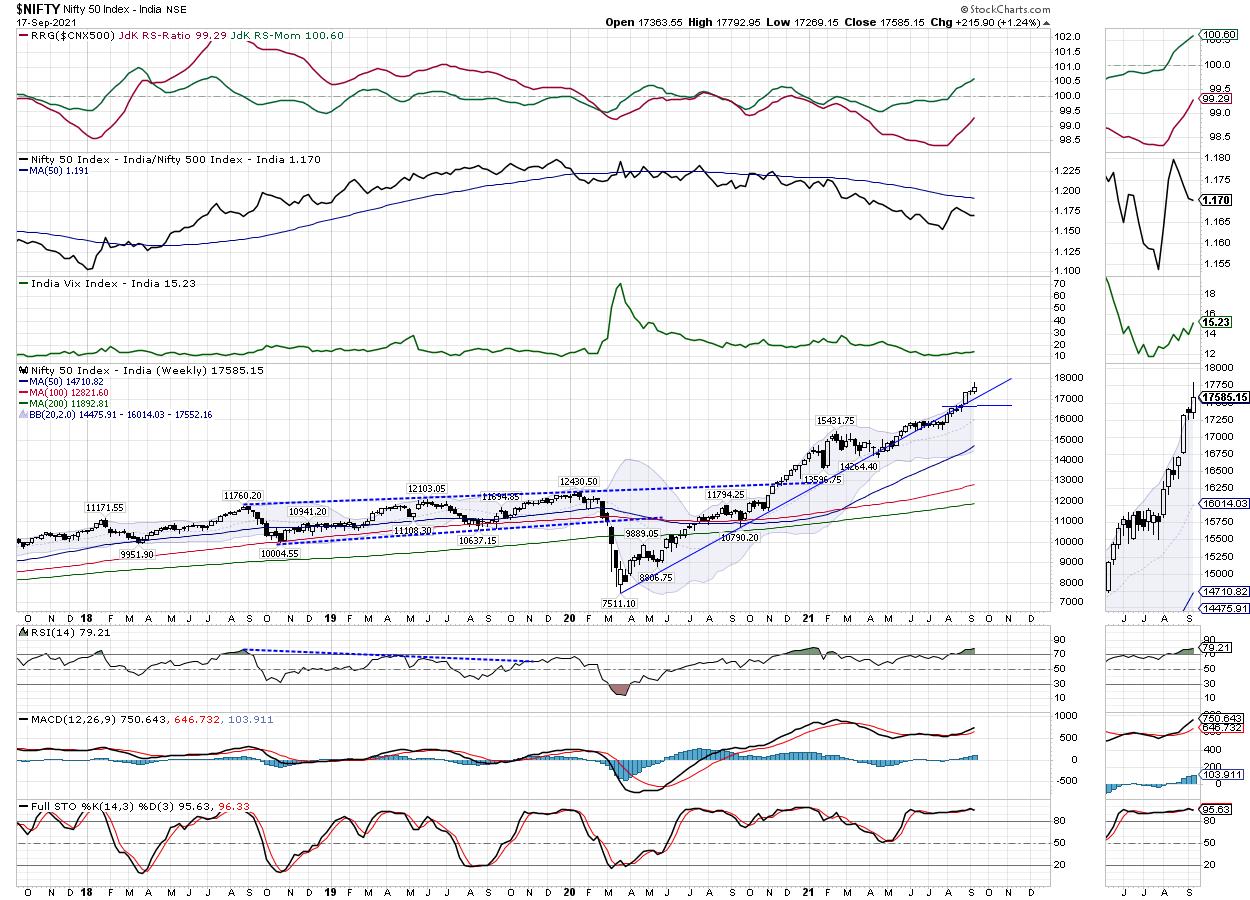
Just like during the week before, the NIFTY remains in the overbought zone. The primary uptrend and the breakout that has occurred above the 15900-15950 levels remains very much intact and in place. The only possibility is that the NIFTY has marked an intermediate top by taking a breather; the level of 17792 is now a very important resistance mark. Friday's action in NIFTY has created a wide trading range for the NIFTY between 17400 on the lower side and 17790 on the higher side. There is some chance that the markets may stay in this broad consolidation range for some time.
The NIFTY PCR across all expiries is healthy and not overbought. The coming week may see the levels of 17680 and 17790 act as resistance. The supports exist at the 17480 and 17355 levels. The trading range is likely to stay wider than usual over the coming days. The volatility increased; INDIAVIX surged by 9.25% to 15.2300.
The weekly RSI is 79.21; it remains in the overbought territory. However, the RSI is neutral and does not show any divergence against the price. The daily MACD is bullish and above the signal line. A white body emerged on the candles; apart from this, no other formations were noticed on the charts.
The pattern analysis shows that the breakout that occurred after the NIFTY crossed above 15900-15950 levels is very much intact. While remaining in the steep uptrend, the NIFTY has just ended near the upper Bollinger band. Over the coming week, the Index may continue tracking the upper band; it also appears to have created a broad consolidation range, with the 17350-17400 zone acting as lower support.
Over the coming days, it is expected that the BankNIFTY index, which was lagging in its relative performance against the NIFTY, will continue to remain resilient and relatively outperform the broader markets. Apart from this, other consolidating sectors like the PSE, Auto and Realty Indexes may also show resilient performance. It is suggested that aggressive positions should be avoided; new purchases may be made in modest quantities and in a highly selective manner. A cautious approach towards the markets is advised for the coming week.
Sector Analysis for the Coming Week
In our look at Relative Rotation Graphs®, we compared various sectors against CNX500 (NIFTY 500 Index), which represents over 95% of the free float market cap of all the stocks listed.
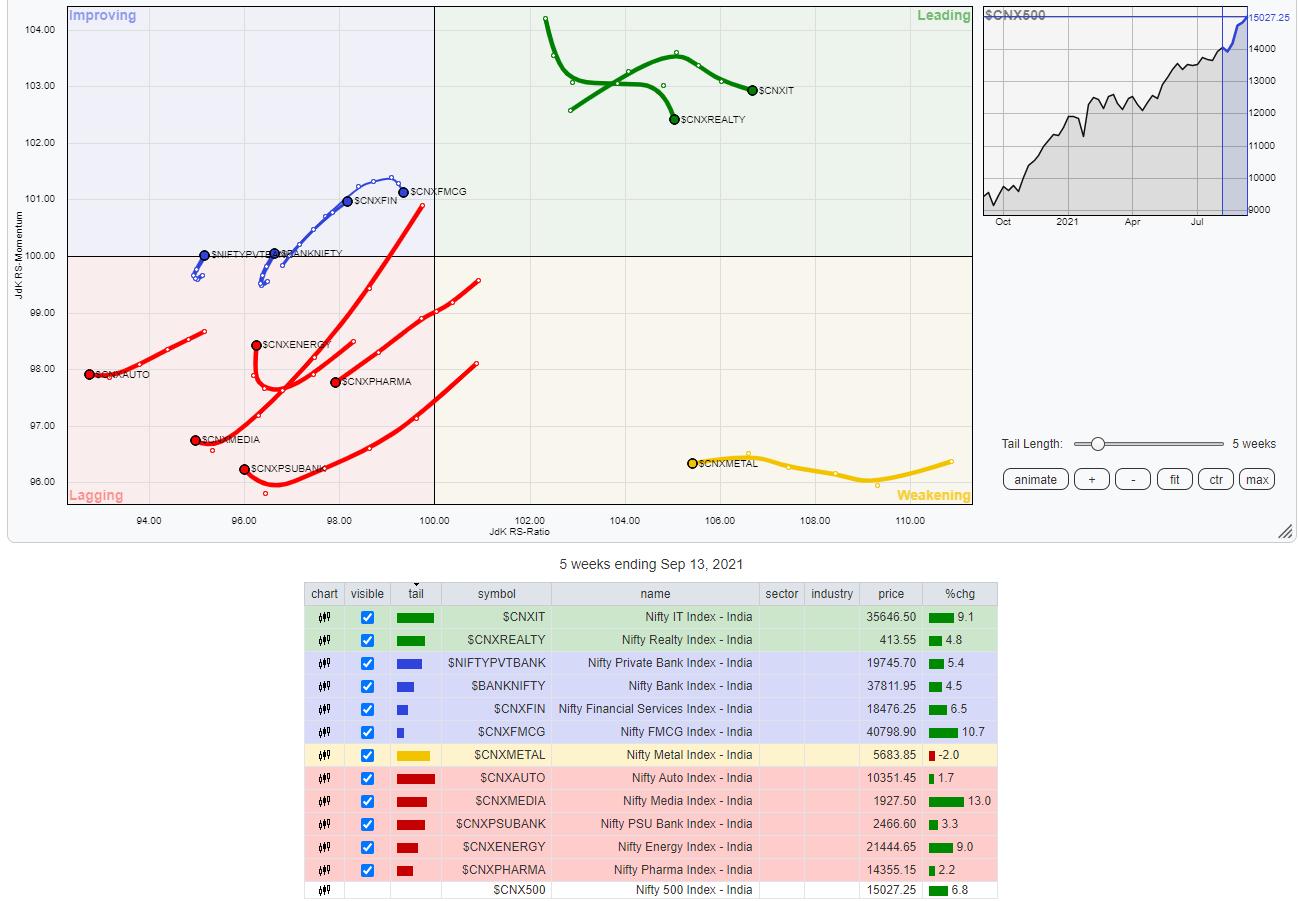
The analysis of Relative Rotation Graphs (RRG) shows that, just on the lines of the previous week, the IT Index, Small-cap and the Realty Index are inside the leading quadrant. They may continue to outperform the broader markets relatively.
The Commodities Index, Metals and the Midcap Index are inside the weakening quadrant. Apart from a few sporadic stock-specific shows, these sectors may not perform much on an individual basis.
The BankNifty index has rolled inside the improving quadrant; this indicates a likely end to this Index's relative underperformance against the broader markets to date. We may see this sector putting up a resilient show over the coming days and may relatively outperform the broader markets.
NIFTY Pharma continues to languish inside the lagging quadrant; this index may underperform over the coming days. Apart from this, Media, PSU Banks, NIFTY PSE, Auto Index and the Energy Index are also inside the lagging quadrant. However, all these groups are seen consolidating and appear to be improving on their relative momentum.
The Infrastructure Index has also rolled inside the improving quadrant. Apart from this, the FMCG, Consumption, Services Sector Index and the Financial Services Index are also placed inside the improving quadrant.
Important Note: RRG™ charts show the relative strength and momentum for a group of stocks. In the above Chart, they show relative performance against NIFTY500 Index (Broader Markets) and should not be used directly as buy or sell signals.
Milan Vaishnav, CMT, MSTA
Consulting Technical Analyst
www.EquityResearch.asia | www.ChartWizard.ae
· For Premium Equity Portfolio Advisory on Indian Stocks, Click Here
· Alpha-generating actionable investment ideas on the US and UK Equities, Click Here
· For International Commodities like Gold, Crude Oil and EURUSD/GBPUSD pairs, Click Here


