In the previous weekly note, it was mentioned that even though the NIFTY and other key indexes are grossly overbought, the options data is continuing to show strength. This also meant that the supports were dragged higher by the NIFTY. While trading on the expected lines, the Indian equity markets put up a resilient show and ended the week with some modest gains. Despite being overbought, the market showed no intention to correct over the past five days. It consolidated in a narrow range, which kept the trading range for the week at just 182 points. While the index consolidated, it closed with a gain of 45.65 points (+0.26%) on a weekly basis.
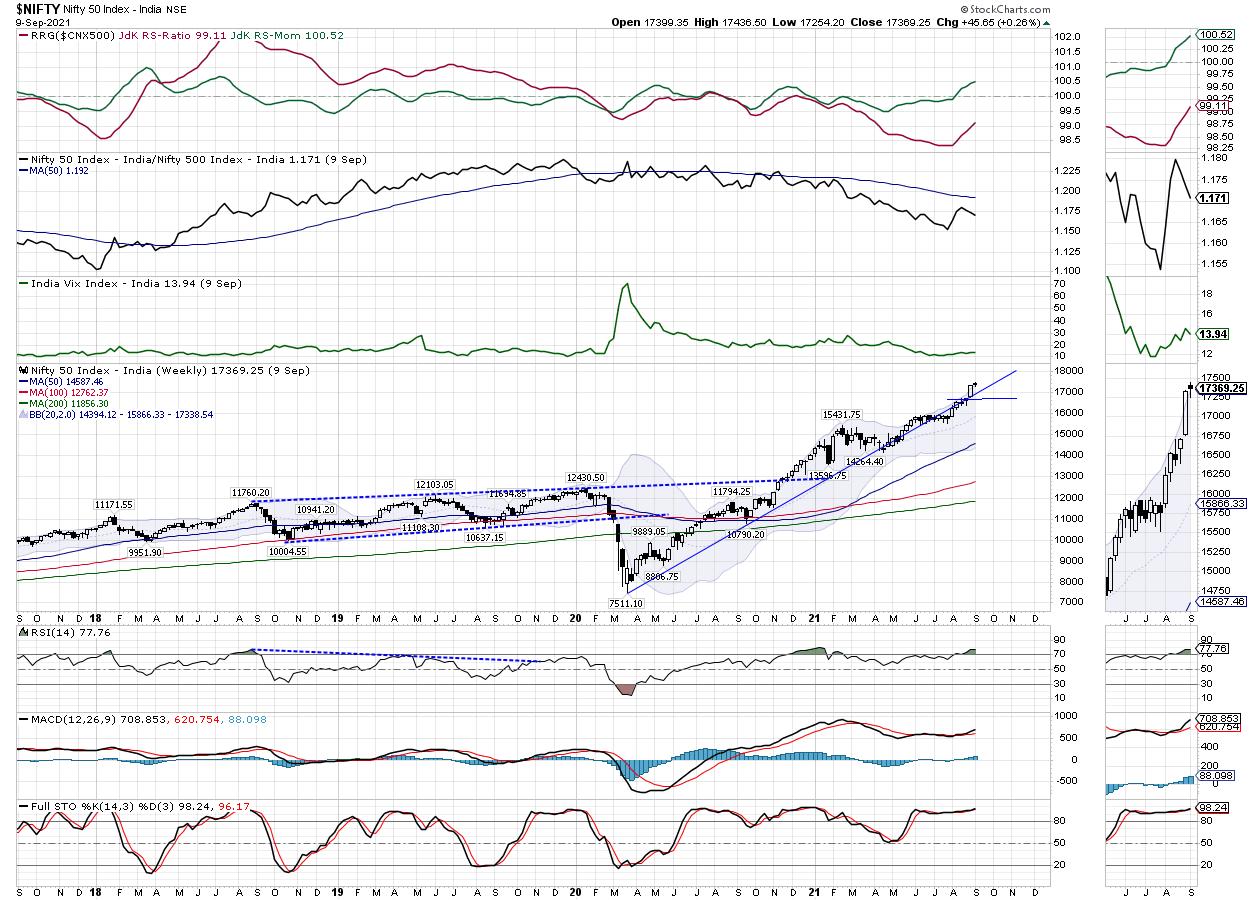
The markets continue to remain overbought on both daily and weekly charts. However, the undercurrents are buoyant; it is also important to note that, when the markets are in a strong uptrend, they tend to remain overbought for some time even if they consolidate. The options data shows that heavy PUT writing continued throughout the week between 17200-17400 levels; this makes the zone of 17000-17200 a strong support area if a minor corrective move or range-bound consolidation happens. There are no visible chances of any major correction happening; however, some ranged consolidation is very much likely at current levels.
The volatility cooled off slightly; INDIAVIX came off by 4.13% to 13.94. The coming week may see a positive start, but the levels of 17480 and 17595 may act as the potential resistance points at higher levels. The supports on the lower side can come in at 17200 followed by 17120. The trading range for the coming week is expected to be wider than usual.
The weekly RSI is 77.76; it remains neutral and does not show any divergence against the price. The weekly MACD is bullish and remains above its signal line. A spinning top occurred on the candles; this reflects a little price action and very little difference between the open and the close levels of the week. This kind of candle also indicates a lack of directional bias that prevailed over the last five days.
The pattern analysis of the weekly chart shows that the main breakout that occurred when the NIFTY moved past the 15900-15950 zone is still very much in force. After each move on the higher side, the markets have consolidated for some time, only to resume their uptrend. As of now, this short-term base has shifted at the 17000 levels, which are expected to act as an immediate support level if a corrective more or a range-bound consolidation happens.
The FMCG and the Consumption indexes have been trading strong. However, some underperformance is still seen in sectors like Auto, Banks and select Pharma and the PSE stocks. We expect these sectors to improve their relative performance against the broader markets over the coming week. We recommend avoiding aggressive shorts and stay very selective while making new purchases. All profits on either side should be vigilantly protected even as the broader primary trend remains intact.
Sector Analysis for the Coming Week
In our look at Relative Rotation Graphs®, we compared various sectors against CNX500 (NIFTY 500 Index), which represents over 95% of the free float market cap of all the stocks listed.
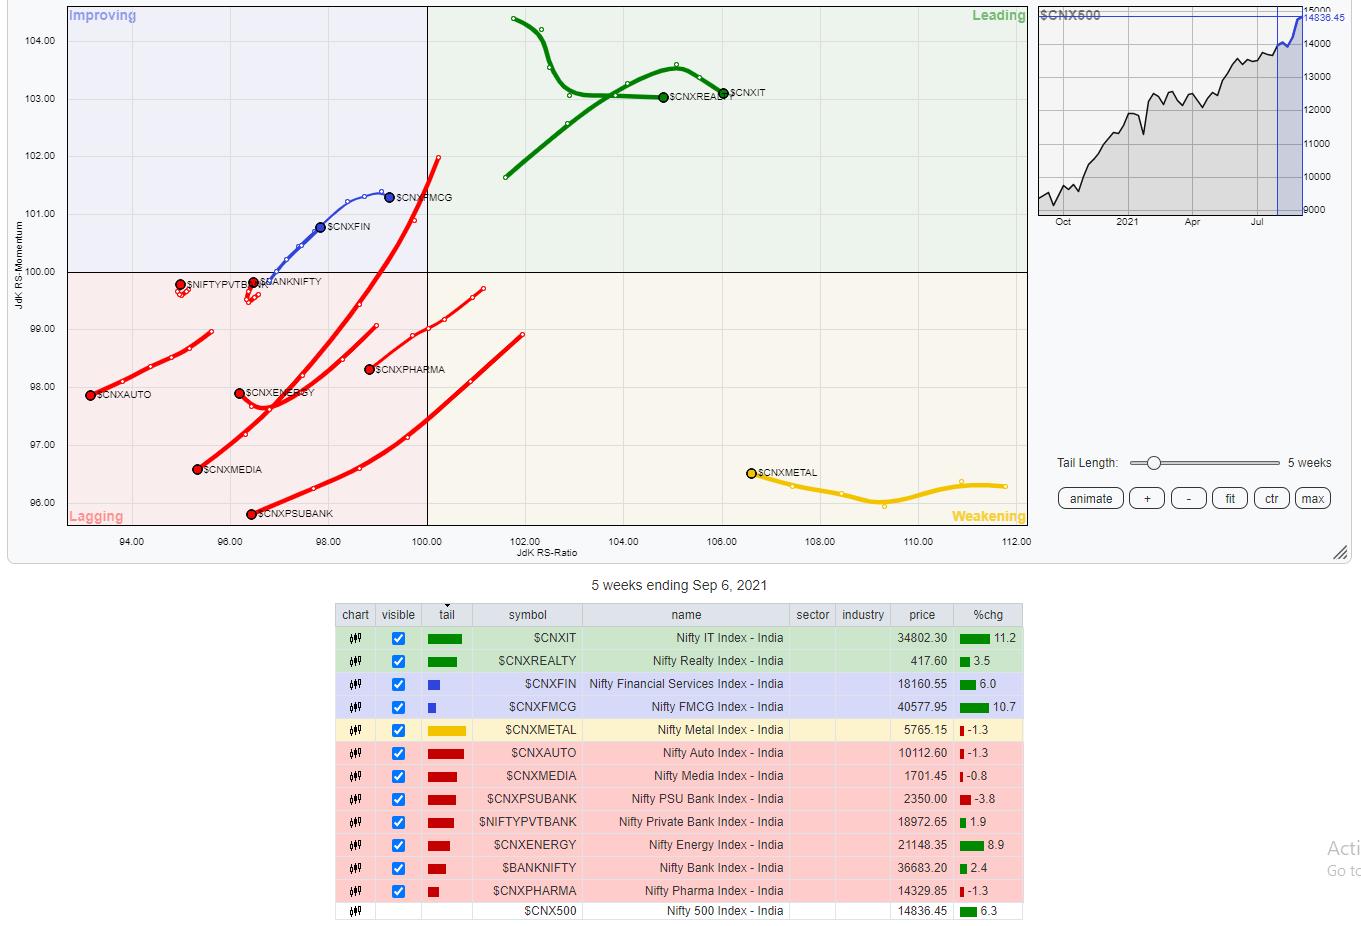
The analysis of Relative Rotation Graphs (RRG) shows that the NIFTY IT Index, Realty Index and the small-cap indexes are inside the leading quadrant; out of these, the Small Cap index is paring its momentum. However, these groups are likely to continue relatively outperforming the broader NIFTY 500 index.
The MIDCAP 100 Index, Commodities and the Metal index are inside the weakening quadrant. Although the Mid-cap index looks slightly weak, all these three indexes are attempting to consolidate their current relative underperformance.
The NIFTY Auto and Pharma Indexes continue to languish inside the lagging quadrant along with the Media Index. These groups are likely to underperform the broader markets. PSU Banks, BankNifty and the Infrastructure, Energy and PSE indexes are inside the lagging quadrant as well. However, they appear to be consolidating and improving their relative momentum against the broader markets.
The Financial Services Index, Services Sector Index, Consumption and the FMCG pack remain firm inside the improving quadrant. It is expected that these groups will continue to show resilience against the broader NIFTY 500 Index.
Important Note: RRG™ charts show the relative strength and momentum for a group of stocks. In the above chart, they show relative performance against NIFTY 500 Index (Broader Markets) and should not be used directly as buy or sell signals.
Milan Vaishnav, CMT, MSTA
Consulting Technical Analyst,
www.EquityResearch.asia | www.ChartWizard.ae


