In the interrupted week that was truncated on account of Dussehra on Friday, the Indian equity markets traded very much on the expected and analyzed lines. In the previous note, it was mentioned that, given the structure of the technical patterns and the analysis of F&O data, the NIFTY is on the cusp of a fresh breakout on the charts. Trading on these lines, the NIFTY continued its surge ahead in the 4-day trading week; it went on to mark fresh lifetime closing highs and managed to end near its high point of the week. The trading range over the week remained 511.65 points. The headline index ended with net gains of 433.35 points (+2.48%) on a weekly note.
Once again, from the technical perspective, NIFTY remains buoyant. Looking at the amount of Put writing being done at the strikes of 18000 and above, while also noting the amount of Call unwinding taking place on these same very strikes, what we see clearly points at strong undercurrents prevailing in the markets. This may not guarantee any unabated up moves, but certainly hints that, if any consolidation or corrective move takes place, it will stay limited in its extent and remain range-bound. The NIFTY has shifted its short-term base much higher at 17900-18000 levels.
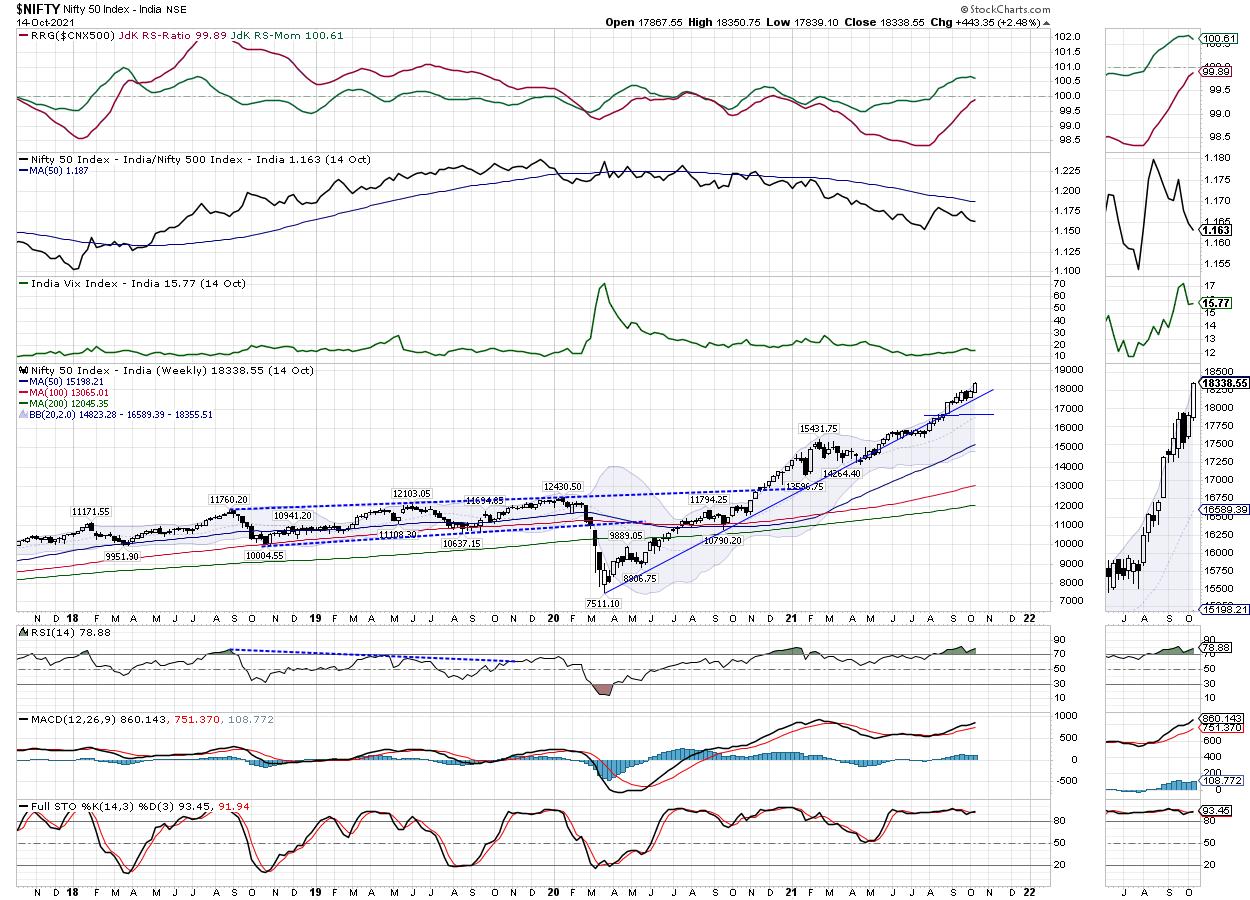
The volatility remained nearly unchanged; INDIAVIX rose marginally by 0.73% to 15.77. The coming week is likely to see the levels of 18500 and 18650 acting as potential resistance points. The supports come in at 18150 and 18000 levels. The trading range over the next five days is likely to stay a bit wider than usual.
The weekly RSI is 78.88; it continues to show a mild negative divergence against the price. This is because, while the price marked a 14-period high, the RSI did not. The MACD is bullish and above the signal line. A strong white candle on the charts reflects a directional consensus on the upside that prevailed during the week.
The pattern analysis shows that, even if the daily charts might look overstretched and overextended, the weekly charts do not appear that way. In fact, except for a minor violation for few weeks in between, the NIFTY is smartly tracking the upper rising trend line drawn from the lows of March 2020. Whenever it has deviated from that trend line, it has consolidated and reverted to its mean.
The coming week shows a high likelihood of the few sectors performing very nicely, with improved Relative Strength against the broader markets. Even if the broader markets tend to consolidate, the sector-specific moves in Realty, PSU Banks, select private banks, financial services stocks, Infrastructure and Autos cannot be ruled out. We may even see Pharma pack trying to consolidate its performance over the coming days. Given the overbought nature of the markets, we recommend avoiding excess leverage, but shorts, in any case, should be avoided. A cautiously positive outlook is advised for the coming week.
Sector Analysis for the Coming Week
In our look at Relative Rotation Graphs®, we compared various sectors against CNX500 (NIFTY 500 Index), which represents over 95% of the free float market cap of all the stocks listed.
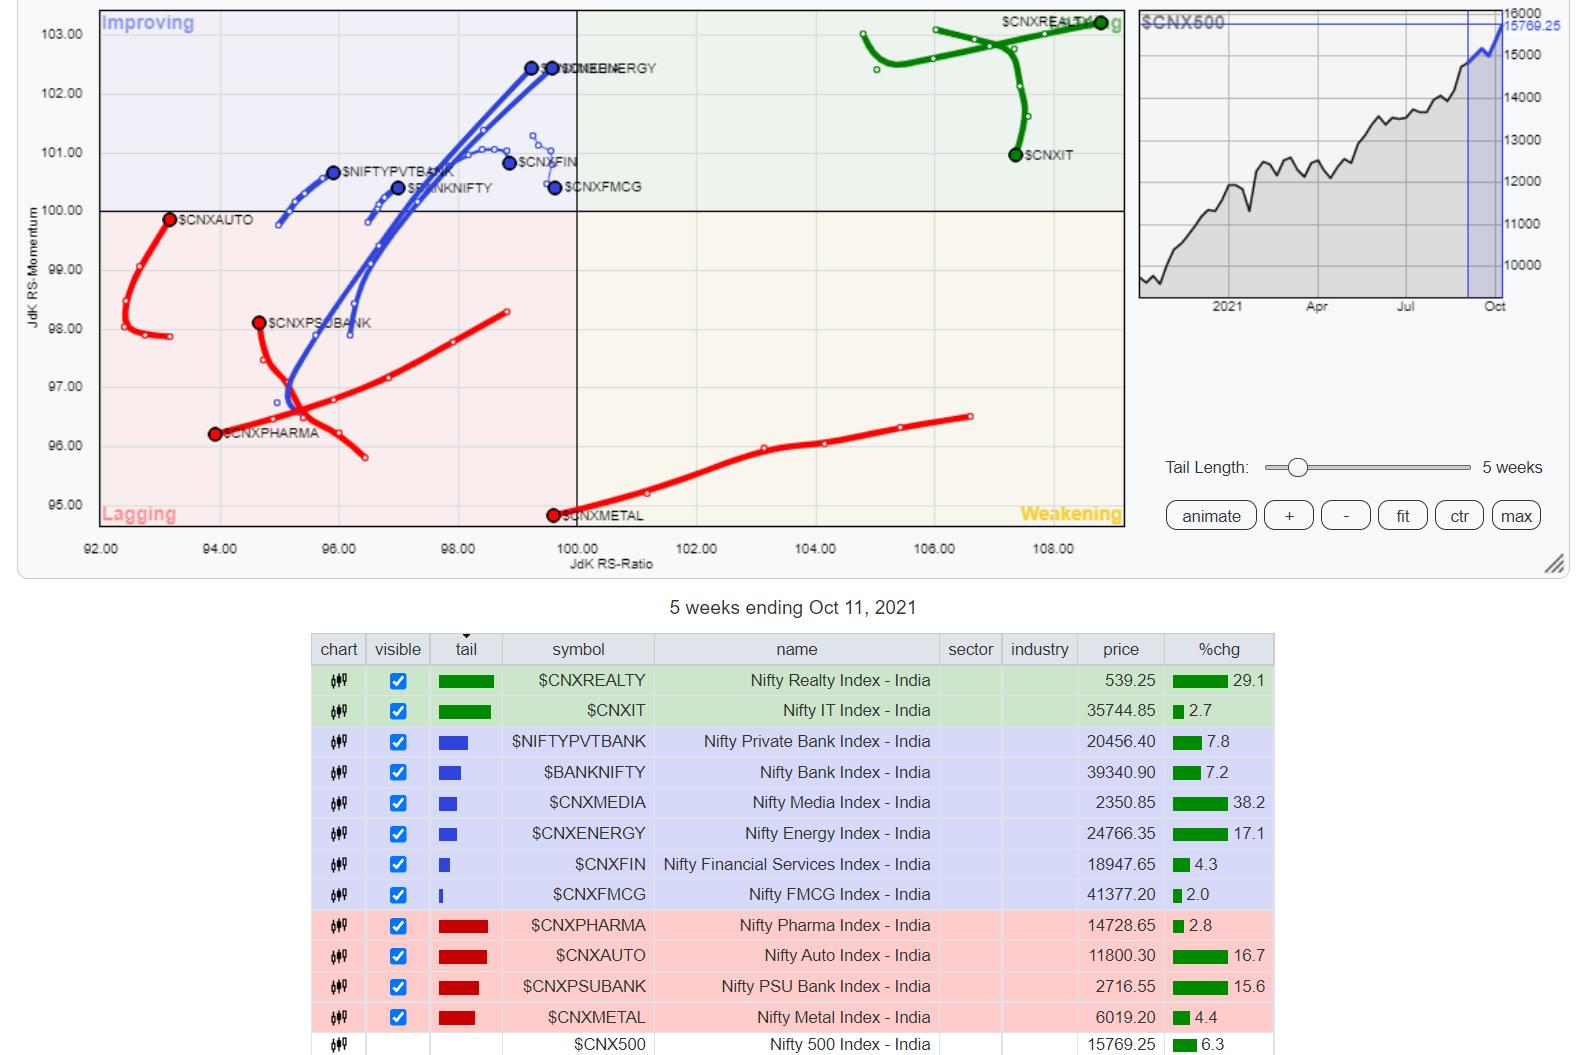
The analysis of Relative Rotation Graphs (RRG) shows the NIFTY Realty, IT, Consumption, Infrastructure and Services Sector indexes placed inside the leading quadrant of the RRG when benchmarked against the broader NIFTY500 Index.
NIFTY MIDCAP50 is the only index placed inside the weakening quadrant. However, that too is seen improving on its relative momentum against the broader markets.
The Metal index has slipped inside the lagging quadrant. Stock-specific isolated performance may be seen, but the index per se is likely to relatively underperform the broader markets. A similar structure is seen with the Pharma Index, also placed inside the lagging quadrant. NIFTY Auto and PSU Bank Index are also inside the lagging quadrant; however, they appear to be greatly improving on their relative performance.
The NIFTY Media and the Energy indexes are seen making strong strides inside the improving quadrant. Along with these groups, NIFTY FMCG, Financial Services, NIFTY Bank, and the PSE Sector Index are also placed inside the improving quadrant. These groups are likely to put up a resilient show over the coming days.
Important Note: RRG™ charts show the relative strength and momentum for a group of stocks. In the above Chart, they show relative performance against NIFTY500 Index (Broader Markets) and should not be used directly as buy or sell signals.
Milan Vaishnav, CMT, MSTA
Consulting Technical Analyst
www.EquityResearch.asia | www.ChartWizard.ae
- For Premium Equity Portfolio Advisory on Indian Stocks, Click Here.
- For Alpha-generating actionable investment ideas on the US and UK Equities, Click Here.
- For International Commodities like Gold, Crude Oil, and EURUSD/GBPUSD pairs, Click Here.


