After testing a fresh lifetime high at 18604, the Indian equity markets slipped into some corrective consolidation within a broad range. The bulk of the previous week was spent in the corrective mode as the NIFTY rapidly lost ground after testing a fresh lifetime high. The past five days saw the Index trading in a 570-point wide range as the NIFTY tracked the upper band of the move. Over the past five days, the NIFTY defined its broad consolidation zone and ended with a net loss of 223.65 points (-1.22%).
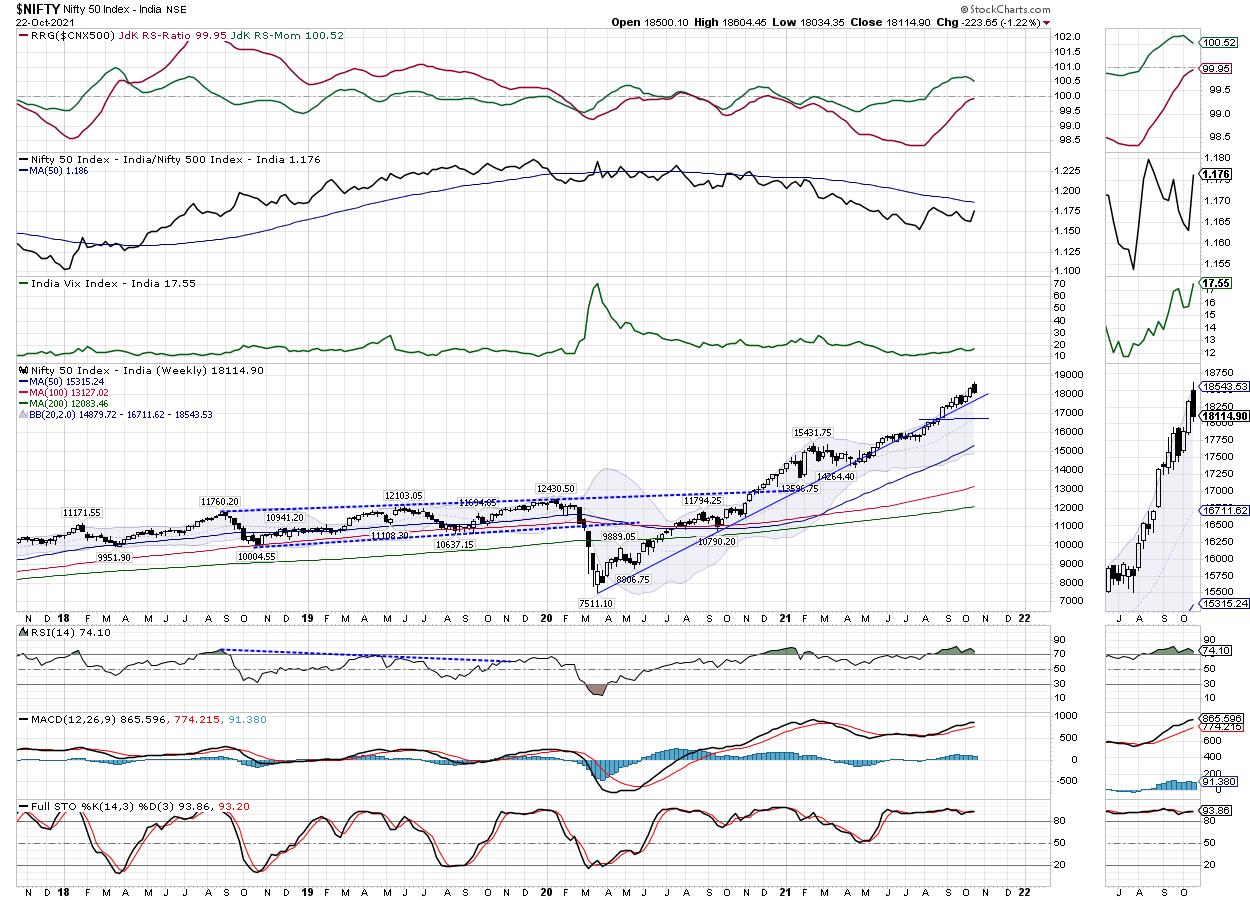
The previous week stayed important from the technical perspective. NIFTY's price action over the previous five days has defined a couple of things. The levels of 18600 have now become an intermediate top for the markets once again. Unless the NIFTY moves past this point, any runway move, or resumption of an uptrend is likely. In the same breath, the NIFTY has defined a broad consolidation range; the 18600 as the upper resistance area and 18000 as a lower support edge of the zone. This means that so long as the NIFTY keeps its head above the 18000 level, no major downsides will now be seen; the markets will continue oscillating in a broad 18000-18600 zone.
Volatility shot up over the past few days; INDIAVIX surged 11.27% to 17.55. The coming week is likely to see the markets attempting to gain stability over the coming days. The levels of 18300 and 18450 are likely to post resistance at higher levels, the levels of 18000 and 17900 are likely to act as supports.
The weekly RSI is 74.10; it stays neutral and does not show any divergence against the price. RSI is in the mildly overbought zone. The weekly MACD is bullish and stays above the signal line. A Dark Cloud cover occurred on the candles. If this occurs at a higher level or during an uptrend, it has the potential to halt the current up move. However, this may require confirmation on the next bar. This has raised the possibility of pushing the Index under some consolidation within a defined range.
The pattern analysis of the weekly chart shows that the NIFTY is in a secular uptrend; it is tracking and is well above the upper rising trend line drawn from the lows of March 2020. Apart from a minor blip, the NIFTY has largely stayed above this upper rising trend line while protecting its secular uptrend.
All in all, looking at the individual technical setups of all sectors, the bulk of the sectors are resiliently placed against the broader markets. Over half of them have their Relative Strength improving against the broader markets. Given the current technical setup, we can expect the pockets like PSE, Banks, PSU Banks, Auto, and select Financial Services stocks to put up a resilient show. We recommend avoiding excessive leveraged exposures and continue approaching the markets in a highly stock-specific way while vigilantly protecting profits at higher levels.
Sector Analysis for the coming week
In our look at Relative Rotation Graphs®, we compared various sectors against CNX500 (NIFTY 500 Index), which represents over 95% of the free float market cap of all the stocks listed.
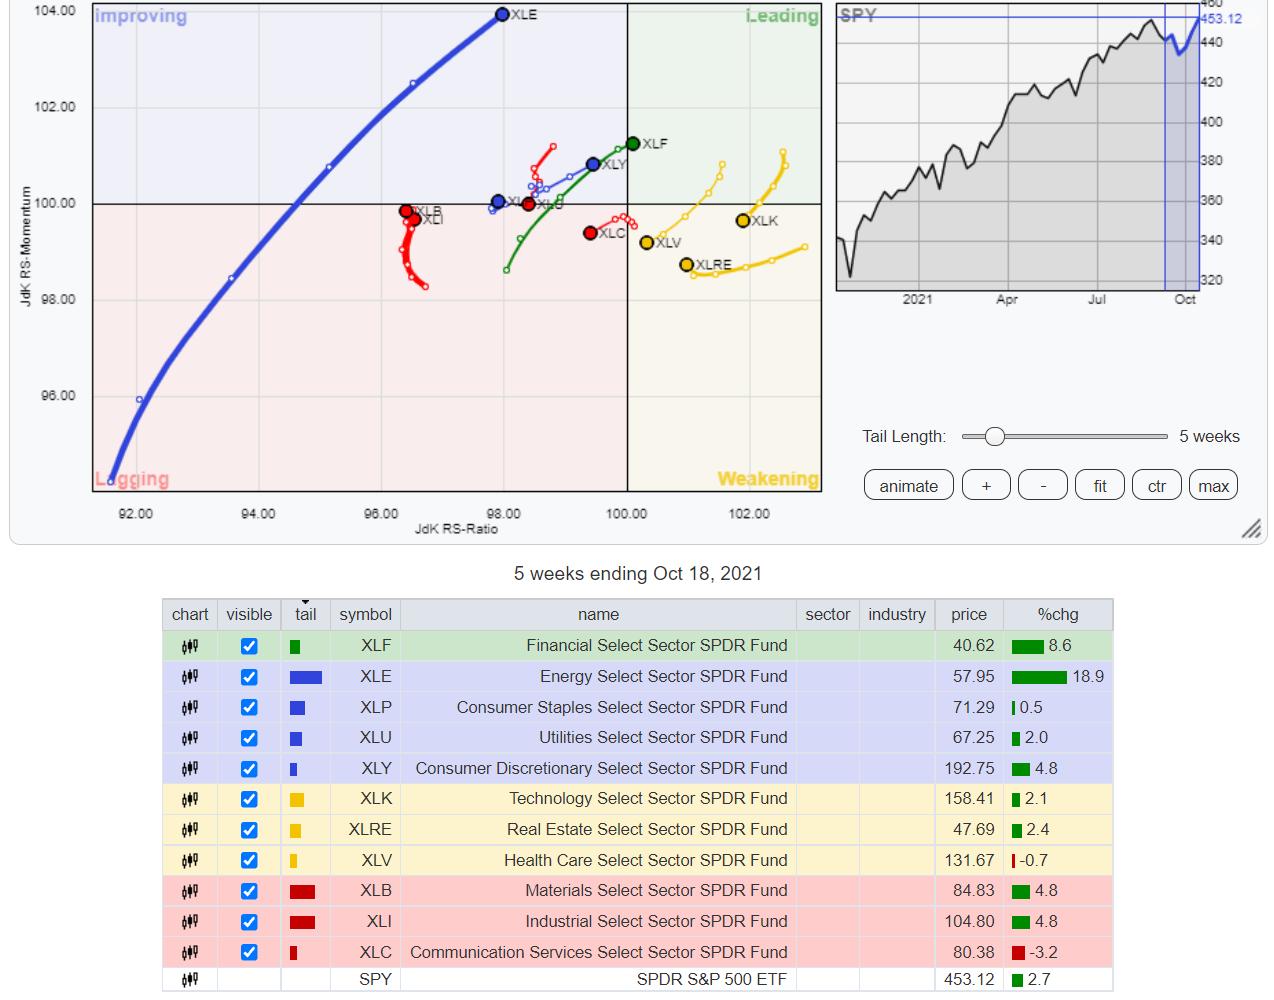
The analysis of Relative Rotation Graphs (RRG) shows that except for one two sectors, none of the other sectors show probability of any major rotational weakness. NIFTY Media and Energy Index have rolled inside the leading quadrant when benchmarked against the broader NIFTY500 index. NIFTY Realty stays firm, and we also have Infrastructure, Services Sector, and Consumption Indexes in the leading quadrant. The IT Index is also inside the leading quadrant, but it appears to be rapidly losing its relative momentum against the broader markets.
NIFTY MidCap 100 is the only index inside the lagging quadrant. However, it is seen rotating towards the leading quadrant while improving on its relative momentum.
NIFTY PSU Bank Index is showing strong northeast rotation while staying inside the lagging quadrant. NIFTY Auto has rolled inside the improving quadrant indicating a likely end to its relative underperformance against the NIFTY500. It has a company of NIFTY PSE Index, NIFTY Bank, and Financial Services Index which are also placed inside the improving quadrant.
NIFTY Pharma and the Metal Indexes are seen languishing inside the lagging quadrant. They will continue to relatively underperform the broader markets.
Important Note: RRG™ charts show the relative strength and momentum for a group of stocks. In the above Chart, they show relative performance against NIFTY500 Index (Broader Markets) and should not be used directly as buy or sell signals.
Milan Vaishnav, CMT, MSTA
Consulting Technical Analyst
www.EquityResearch.asia | www.ChartWizard.ae
- For Premium Equity Portfolio Advisory on Indian Stocks, Click Here
- Alpha-generating actionable investment ideas on the US and UK Equities Click Here
- For International Commodities like Gold, Crude Oil and EURUSD/GBPUSD pairs Click Here


