The Indian equity markets were just consolidating and trying to find a base for themselves in the first four of the last five trading sessions. However, it was the last session of the week, on Friday, that did much of the undoing for the markets. Even though there were no cues from the US following the Thanksgiving holiday, the Asian markets tanked on Friday following renewed Covid fears. Indian markets were no exception; they ended up on a very weak note on Friday. Adding up to the five trading days, the Indian markets had an 800-point trading range. The NIFTY finally closed with a net loss of 738.35 points (-4.16%) on a weekly basis.
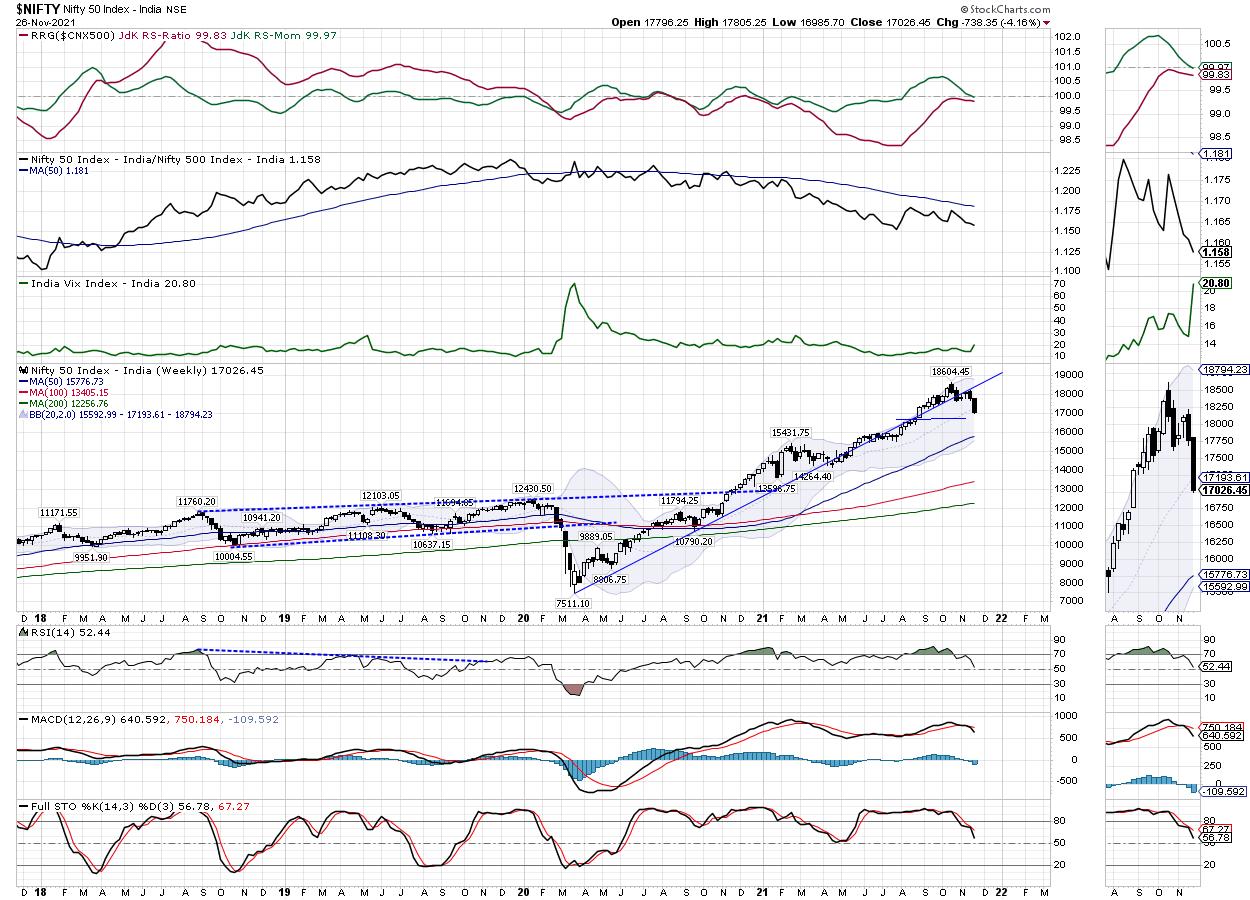
The NIFTY has shown one of its worst weekly performances over the recent past. The Index has not only dropped off the 20-month rising trend line that began from the lows of March 2020 and joined the subsequent higher bottoms, but has also marked and confirmed the point of 18600 as a top for the markets. The fear and the extent of knee-jerk reaction were visible, as the volatility surged through the roof. The INDIAVIX spiked by a huge 40.01% on the weekly basis to 20.8000. The technical landscape remains precarious; on the daily chart, the NIFTY has tested 100-DMA. On the higher weekly time frame, the Index has ended up testing the 20-period MA. In either case, this may not have distinctly disrupted the primary trend, but has certainly pushed the markets in a broad trading range.
The coming week is expected to be jittery; the trading range is likely to stay wider than usual. The levels of 17300 and 17480 will act as immediate resistance levels; the supports come in at 16900 and 16750.
The weekly RSI is 52.38; it has marked a new 14-period low and shows a bearish divergence against the price. The weekly MACD is bearish and trades below its signal line. A large black candle emerged; it reflects a directional consensus of the market participants on the downside.
The pattern analysis shows that, after slipping below the upward rising trend line drawn from the lows of March 2020, the Index resisted this pattern resistance for two weeks and has finally resumed its downtrend. This now marks this rising trend line as a strong pattern resistance for the markets whenever a technical pullback occurs. The broader pattern analysis reveals that, unless taken out convincingly, the NIFTY has 18600 as a potential top in place.
All and all, without any doubt, there is a greater chance that the coming week may stay jittery as the markets grapple to find a bottom for themselves. Also, we are expecting to see that the stocks/sectors with improving Relative Strength to potentially show resilience, but, at the same time, we are likely to see renewed interest in the traditionally defensive sectors like Pharma, FMCG and Consumption. It is recommended that leveraged positions on either side should be avoided. A highly cautious and very selective approach is advised for the coming week.
Sector Analysis for the Coming Week
In our look at Relative Rotation Graphs®, we compared various sectors against CNX500 (NIFTY 500 Index), which represents over 95% of the free float market cap of all the stocks listed.
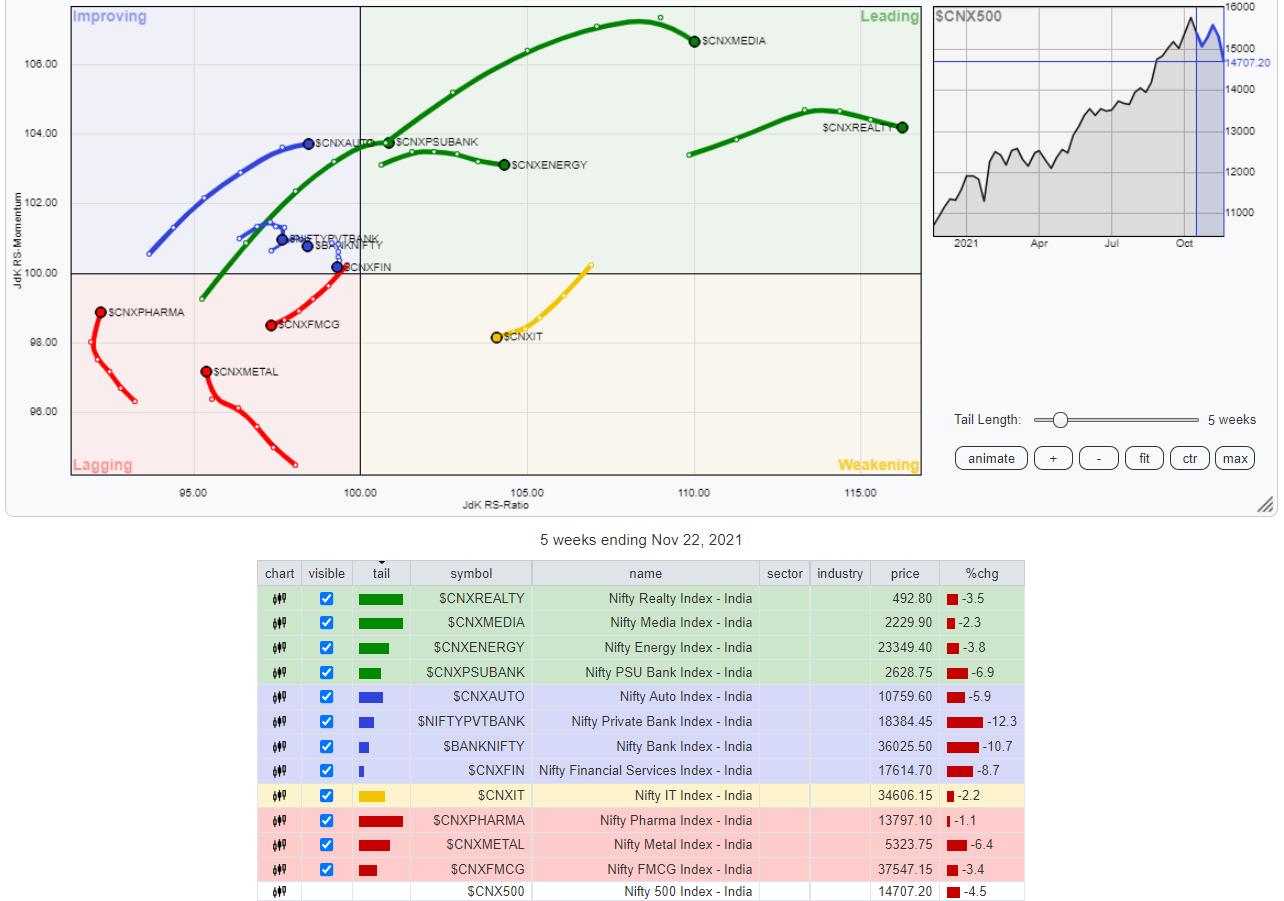
The analysis of Relative Rotation Graphs (RRG) does not show any noticeable change in the sector setup that existed in the previous week. The PSU Bank Index, along with NIFTY Energy, Midcap 100, PSE, Realty, Media and Infrastructure, continues to remain inside the leading quadrant; these are set to relatively outperform the broader NIFTY 500 Index.
The Small-Cap 100 Index and NIFTY IT Index remain inside the weakening quadrant; the SmallCap 100 index is seen sharply improving its relative momentum. The NIFTY Services sector index has also slipped inside the weakening quadrant.
NIFTY FMCG continues to languish inside the lagging quadrant. Apart from this, the Commodities and Metal Indexes are also inside the lagging quadrant; however, they appear to be consolidating on their relative momentum. The NIFTY Pharma Index, despite being in the lagging quadrant, appears to be sharply improving its relative momentum against the broader markets.
The Auto Index and BankNifty are inside the improving quadrant of the RRG. The Financial Services Index is also inside the weakening quadrant; however, it appears to be rapidly paring its relative momentum against the broader markets.
Important Note: RRG™ charts show the relative strength and momentum for a group of stocks. In the above Chart, they show relative performance against NIFTY500 Index (Broader Markets) and should not be used directly as buy or sell signals.
Milan Vaishnav, CMT, MSTA
Consulting Technical Analyst
www.EquityResearch.asia | www.ChartWizard.ae
- For Premium Equity Portfolio Advisory on Indian Stocks, Click Here.
- Alpha-generating actionable investment ideas on the US and UK Equities, Click Here.
- For International Commodities like Gold, Crude Oil and EURUSD/GBPUSD pairs, Click Here.


