The markets had a truncated week, with Friday being a trading holiday on account of Gurunanak Jayanti. In the four-day trading week, the NIFTY remained in corrective mode and ended on a negative note all four trading days of the week. In the process, the Index has violated important supports on the daily as well as the weekly charts. In a 521-point trading range, the NIFTY did not oscillate much back and forth; instead, it maintained a directional consensus on the downside. Following sustained corrective pressure, the headline Index ended with a net loss of 337.95 points (-1.87%) on a weekly basis.
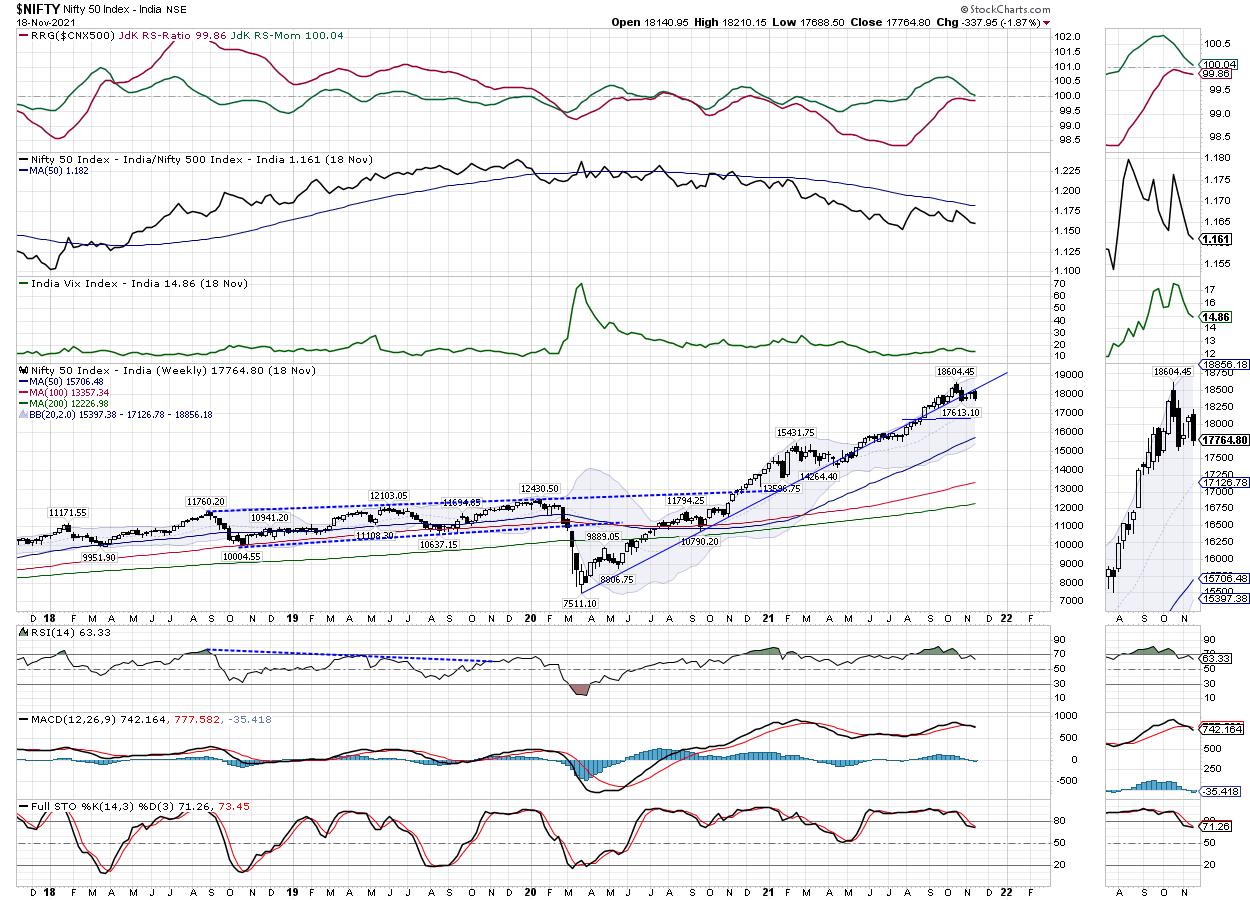
Examining the technical landscape, the NIFTY has finally breached the potentially bearish Head-and-Shoulders pattern on the daily chart. It did so by slipping below the neckline, also coinciding with the 50-DMA which stands at 17850. On the weekly charts, the NIFTY has violated a long upward rising trend line support by slipping below it. This trend line begins from the low point created in March 2020 and joins the subsequent higher bottoms on the weekly chart. In any case, by doing so, the NIFTY has dragged its resistance lower to 17900-18000 levels. Over the coming week, the NIFTY will face stiff resistance at this point if it tries to stage any technical pullback.
Volatility declined; INDIAVIX came off by 2.37% to 14.8600 on a weekly basis. A jittery start to the week is expected; the options data shows that the levels of 17900 and 18000 will act as potential resistance points. The supports come in at the 17630 and 17510 levels.
The weekly RSI is 63.28; it shows a mild bearish divergence against the price. The weekly MACD has shown a negative crossover; it is now bearish and below the signal line. A Bearish Engulfing Candle has emerged and, subject to confirmation on the next bar, it may have bearish implications. It also reflects the directional consensus of the market participants.
The pattern analysis shows that the NIFTY has violated the 20-month-long upward rising trend line. This trend line begins from the lows of March 2020 and joins the subsequent higher bottoms.
All in all, given the continuing selling pressure on the markets, we reiterate staying light on the leveraged exposures. However, global asset allocation models show Equities entering the leading quadrant. This means that equities, as an asset class, may resume their relative outperformance against other assets. Even if the markets remain under corrective pressure, we will see few select pockets doing good and relatively outperforming the broader markets. It is recommended that the markets be approached on a very selective note; no excessively leveraged shorts must be created, as some short covering is expected, and a cautious outlook should be maintained while protecting profits on either side of the trade. The price behavior of the markets vis-à-vis the zone of 18000-18150 will be crucial over the coming days.
Sector Analysis for the Coming Week
In our look at Relative Rotation Graphs®, we compared various sectors against CNX500 (NIFTY 500 Index), which represents over 95% of the free float market cap of all the stocks listed.
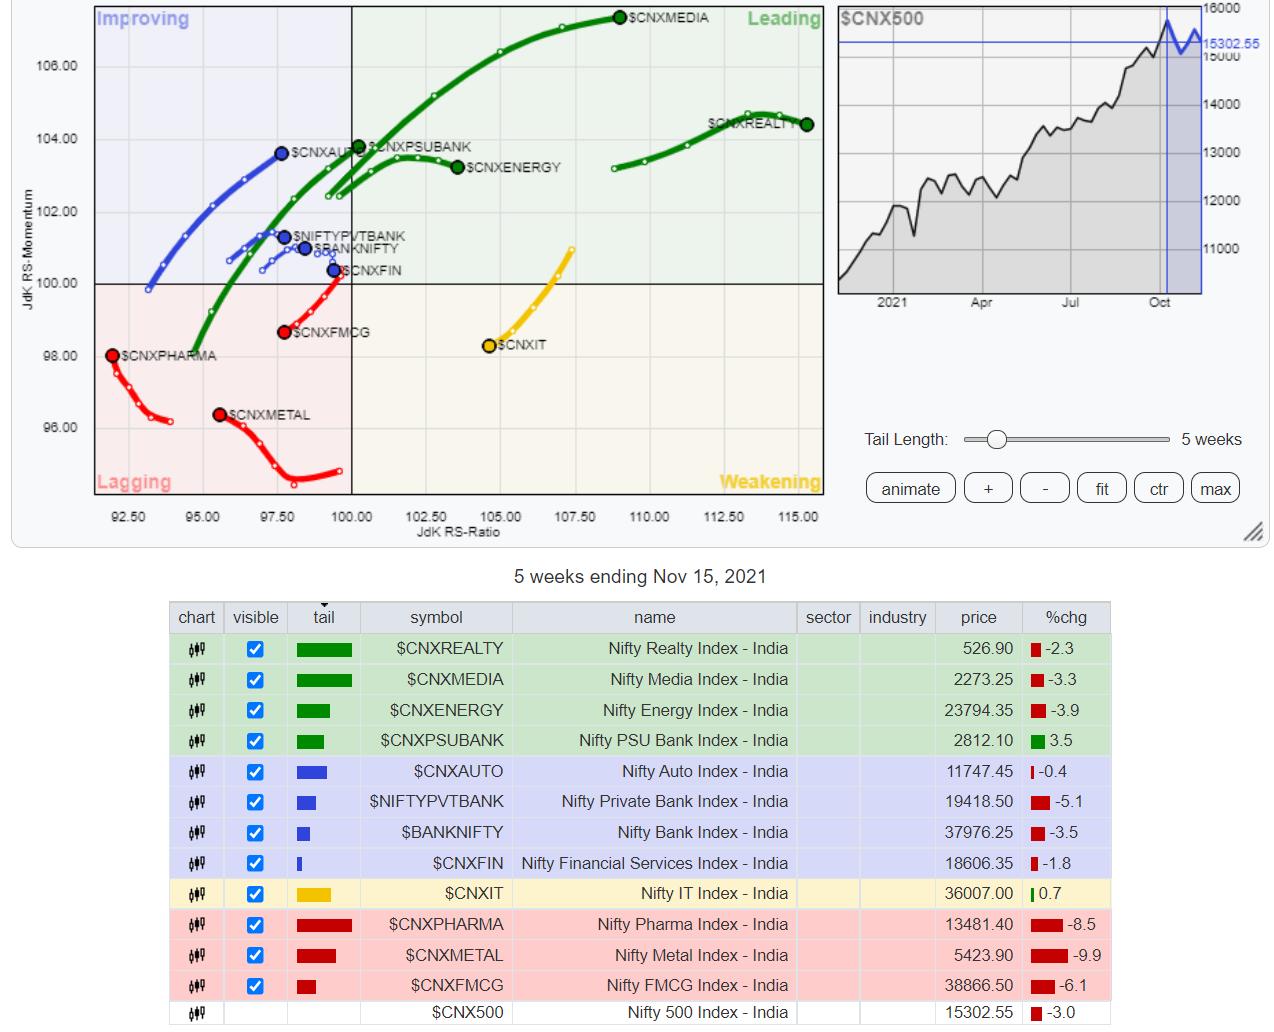
The analysis of Relative Rotation Graphs (RRG) shows that the PSUBANK Index has rolled inside the leading quadrant. This Index, along with the NIFTY Energy, Midcap 100, PSE, Realty, Media and Infrastructure Indexes inside the leading quadrant as well, will relatively outperform the broader NIFTY500 Index.
NIFTY IT Index remains inside the weakening quadrant.
NIFTY FMCG continues to languish inside the lagging quadrant. Apart from this, the Commodities and Metal Index are also inside the lagging quadrant; however, they appear to be consolidating on their relative momentum. The NIFTY Pharma Index, also inside the lagging quadrant, is seen improving on its relative momentum. It is in the process of finding an end to its relative underperformance.
The Auto Index moves steadily inside the improving quadrant. Apart from that, BankNifty and the Financial Services Index are also inside the improving quadrant of the RRG when benchmarked against the broader markets.
Important Note: RRG™ charts show the relative strength and momentum for a group of stocks. In the above Chart, they show relative performance against NIFTY500 Index (Broader Markets) and should not be used directly as buy or sell signals.
Milan Vaishnav, CMT, MSTA
Consulting Technical Analyst
www.EquityResearch.asia | www.ChartWizard.ae
- For Premium Equity Portfolio Advisory on Indian Stocks, Click Here.
- Alpha-generating actionable investment ideas on the US and UK Equities, Click Here.
- For International Commodities like Gold, Crude Oil and EURUSD/GBPUSD pairs, Click Here.


