In predominantly weak trading days over the entire past week, the Indian equity markets not only violated a few important levels, but also grossly underperformed the global markets. All of the last five trading days remained weak as the NIFTY failed to move past the 17500 level. After a failed attempt, the markets faced serious selling pressure throughout the week. The trading range over the past five days remained wider than usual; NIFTY oscillated 673 points during the week. Showing no signs of recovery during any time over the past five days, the headline index ended with a net loss of 526.10 points (-3.00%) on a weekly basis.
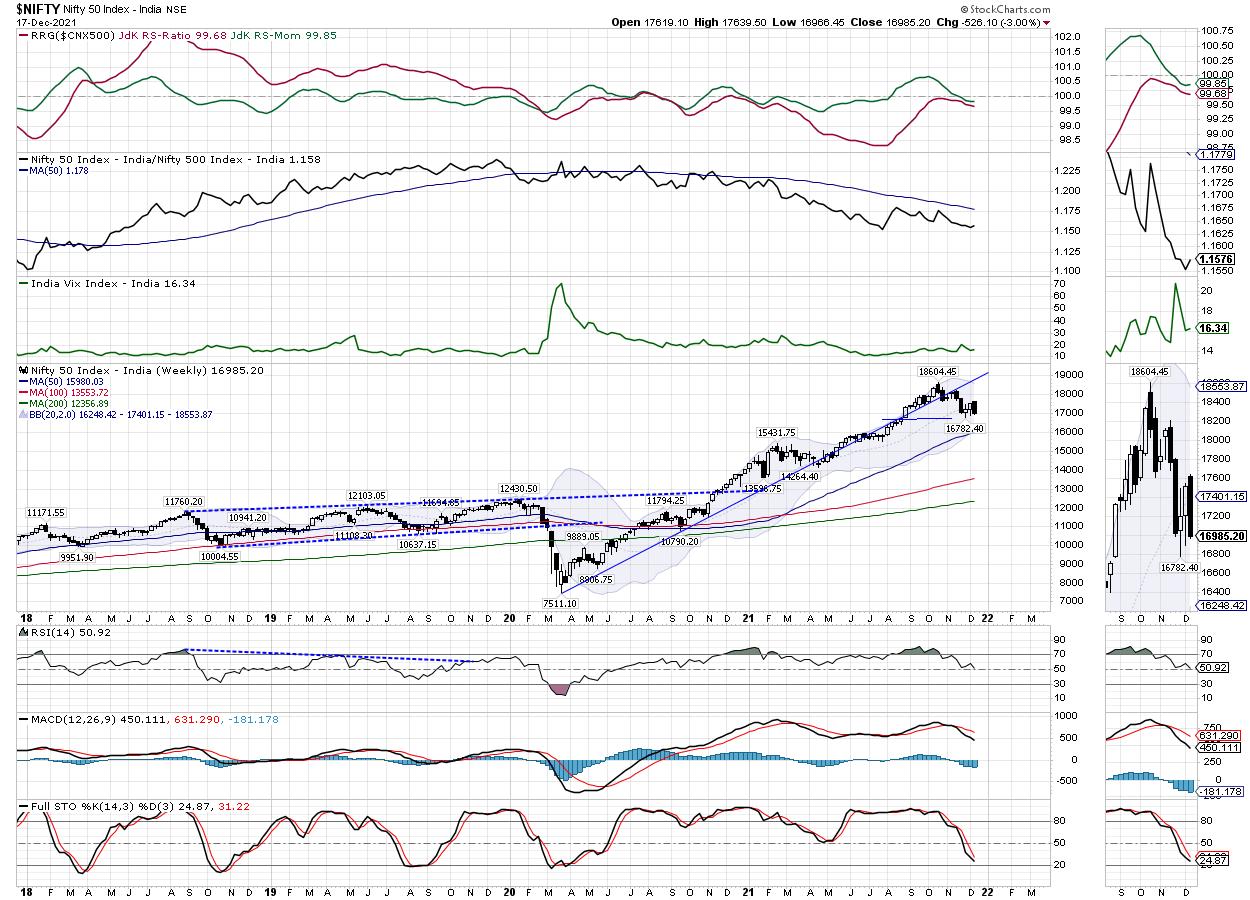
The coming week remains an extremely crucial one; it would be of paramount importance for the markets to defend the most immediate low point of 16782. If this is violated, then the markets may be in for some more trouble. The NIFTY has also slipped below the 20-period MA, which presently stands at 17405. This has dragged the resistance point for the NIFTY lower. The most immediate zone for the NIFTY gets formed between 16780-17400; the index will have to move past this point to resume upward momentum. A few signs have also emerged that hint at possible pullback, making the coming week all the more important to watch.
Volatility inched higher; the INDIAVIX climbed 1.73% to 16.34. The coming week is likely to see the levels of 17200 and 17400 acting as resistance points. The supports come in at the 16780 and 16680 levels. The trading range is likely to remain wider than usual over the coming days.
The Relative Strength Index (RSI) on the weekly chart is 50.87. RSI shows a bullish divergence against the price; while the price made a fresh 14-period low, the RSI did not. This resulted in a bullish divergence. The weekly MACD is bearish and below the signal line.
A bearish engulfing candle has emerged on the charts. This has occurred following a downtrend and near minor pattern support. This may likely need a reversal and the formation of a probable base. However, it is extremely important to note that this will need confirmation and the NIFTY will also have to defend the most immediate low point of 16782.
As mentioned in the previous weekly technical note, the NIFTY moving past the 17000-17200 zone will be important. If the NIFTY moves above this zone, it will at least remain under broad consolidation and not invite incremental weakness. Defending the levels of 16780 will be crucial; we will see the markets continuing to stay highly stock-specific over the coming days. Any particular sectoral dominance is unlikely; however, we may see pockets like Consumption, Midcap, select Auto and the Pharma stocks doing relatively well along with IT. It is recommended to avoid aggressive exposures; a highly cautious and selective approach is advised for the coming week.
Sector Analysis for the Coming Week
In our look at Relative Rotation Graphs®, we compared various sectors against CNX500 (NIFTY 500 Index), which represents over 95% of the free float market cap of all the stocks listed.
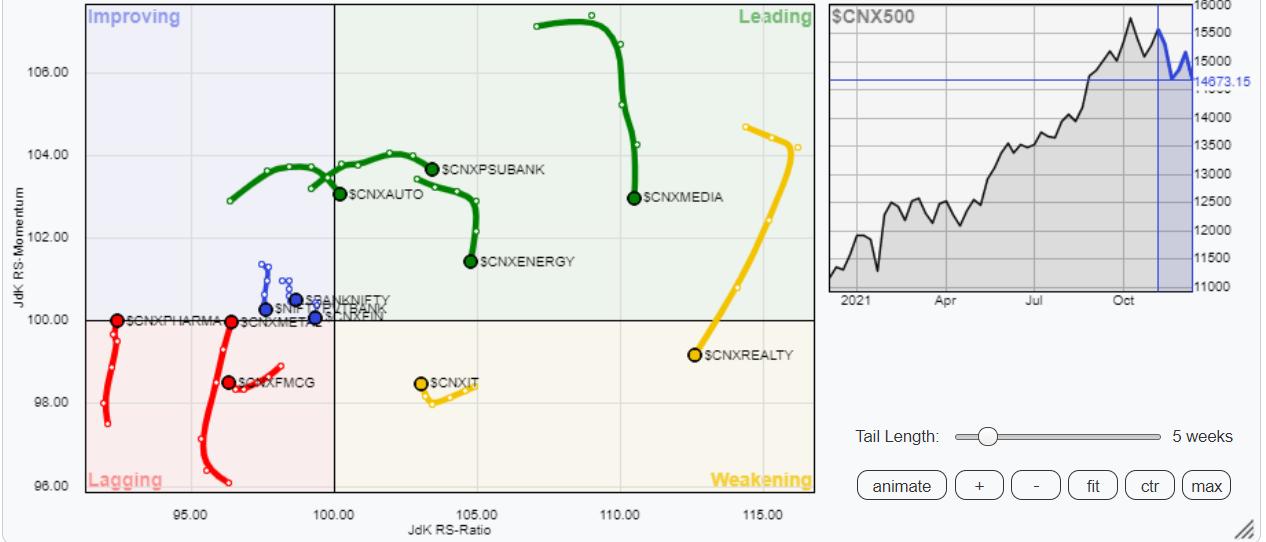
The analysis of Relative Rotation Graphs (RRG) shows that the Auto Index has rolled inside the leading quadrant. Apart from that, the NIFTY Energy, Infrastructure, Midcap, PSUBank, and Media indexes are also inside the leading quadrant.
The NIFTY Realty index has slipped inside the weakening quadrant. Apart from this, the NIFTY IT and the SmallCap index are also inside the weakening quadrant, but they appear to be improving on their relative momentum. NIFTY Service sector index has also rolled inside the weakening quadrant.
The NIFTY FMCG continues to languish inside the lagging quadrant, along with the Consumption Index. NIFTY Metal is also inside the lagging quadrant, but it is seen sharply improving on its relative momentum.
The Pharma index has rolled inside the improving quadrant. This hints at a possible end to the relative underperformance of this sector. NIFTY Bank also remains in the improving quadrant.
Important Note: RRG™ charts show the relative strength and momentum for a group of stocks. In the above Chart, they show relative performance against NIFTY500 Index (Broader Markets) and should not be used directly as buy or sell signals.
Milan Vaishnav, CMT, MSTA
Consulting Technical Analyst
www.EquityResearch.asia | www.ChartWizard.ae
- For Premium Equity Portfolio Advisory on Indian Stocks, Click Here.
- Alpha-generating actionable investment ideas on the US and UK Equities, Click Here.
- For International Commodities like Gold, Crude Oil and EURUSD/GBPUSD pairs, Click Here.


