After ending with gains in the week prior, this week the NIFTY continued with its pullback and has closed with gains again. The trading range continued to remain wider on the expected lines as the NIFTY oscillated 651.55 points over the previous week. After a very bad and weak start on Monday, the next four days were spent with the markets staging strong and sharp pullbacks as they also crawled above some important resistance levels. While continuing to maintain an inherently strong undercurrent, the headline index closed with net gains of 314.60 points (+1.83%) on a weekly basis.
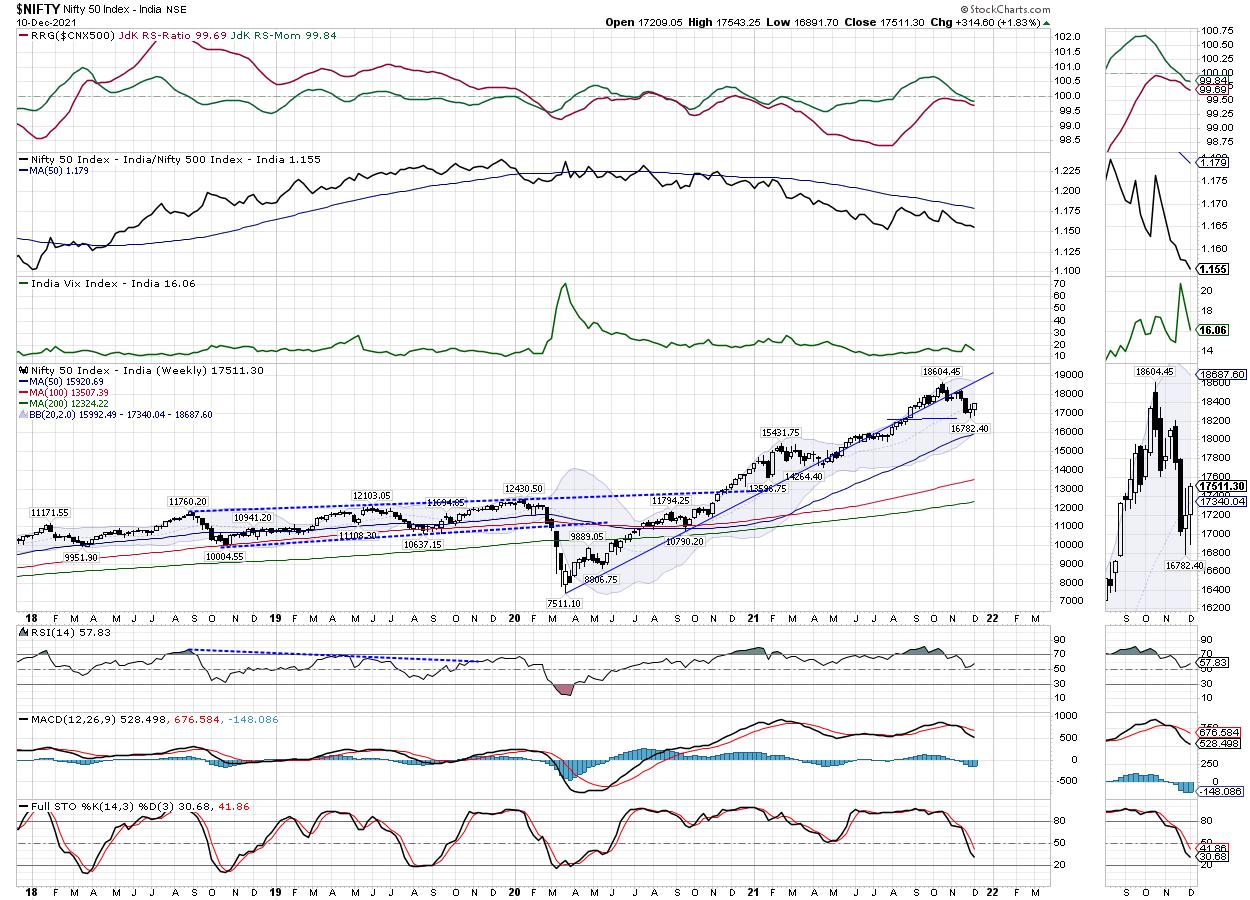
Looking at things from a technical perspective, the NIFTY has closed near its high point. This increases the possibility of the pullback getting extended over the coming days. Importantly, the NIFTY has also crawled above the 20-Week MA, which presently stands at 17344. Staying above this point will be very important. The longer the NIFTY stays above this point, the higher will be the chances of the current technical pullback getting extended. The low point of this week, the 16900 level, will continue to remain sacrosanct support. Any violation of this point in the future will lead to long-lasting weakness creeping in the markets. Following the resumption of the up move after a sharp reversion to the mean, the primary uptrend continues to remain intact.
Along with the surge in the markets, the volatility declined. INDIAVIX came off by 12.98% to 16.06. The coming week is likely to see the levels of 17650 and 17800 acting as potential resistance; the supports will come in at 17350 and 17180 levels. The trading range for the coming week is likely to remain wider than usual.
The weekly RSI is 57.78; it is neutral and does not show any divergence against the price. The weekly MACD is bearish and stays below the signal line.
The pattern analysis shows that the NIFTY still remains below the 18-month long upward rising trend line. This trend line begins from the lows formed in March 2020 and joins the subsequent higher bottoms. The NIFTY has violated this trend line; it is presently below this pattern resistance. However, the upward primary trend remains intact.
Over the past five days, there is clear evidence of the discomfort of the market participants at lower levels. Not only we have seen strong short covering from lower levels, but we have seen fresh longs added as well across the sectors, as evident from the F&O data. Speaking on the broader terms, although we may not blindly chase the up moves, we recommend avoiding shorts so long as the NIFTY stays above the 17000-17200 levels. Over the coming days, we may not see any particular sector dominating the moves, but pockets like Pharma, Consumption, IT, select banks, and Auto are likely to relatively outperform the broader markets.
Sector Analysis for the Coming Week
In our look at Relative Rotation Graphs®, we compared various sectors against CNX500 (NIFTY 500 Index), which represents over 95% of the free float market cap of all the stocks listed.
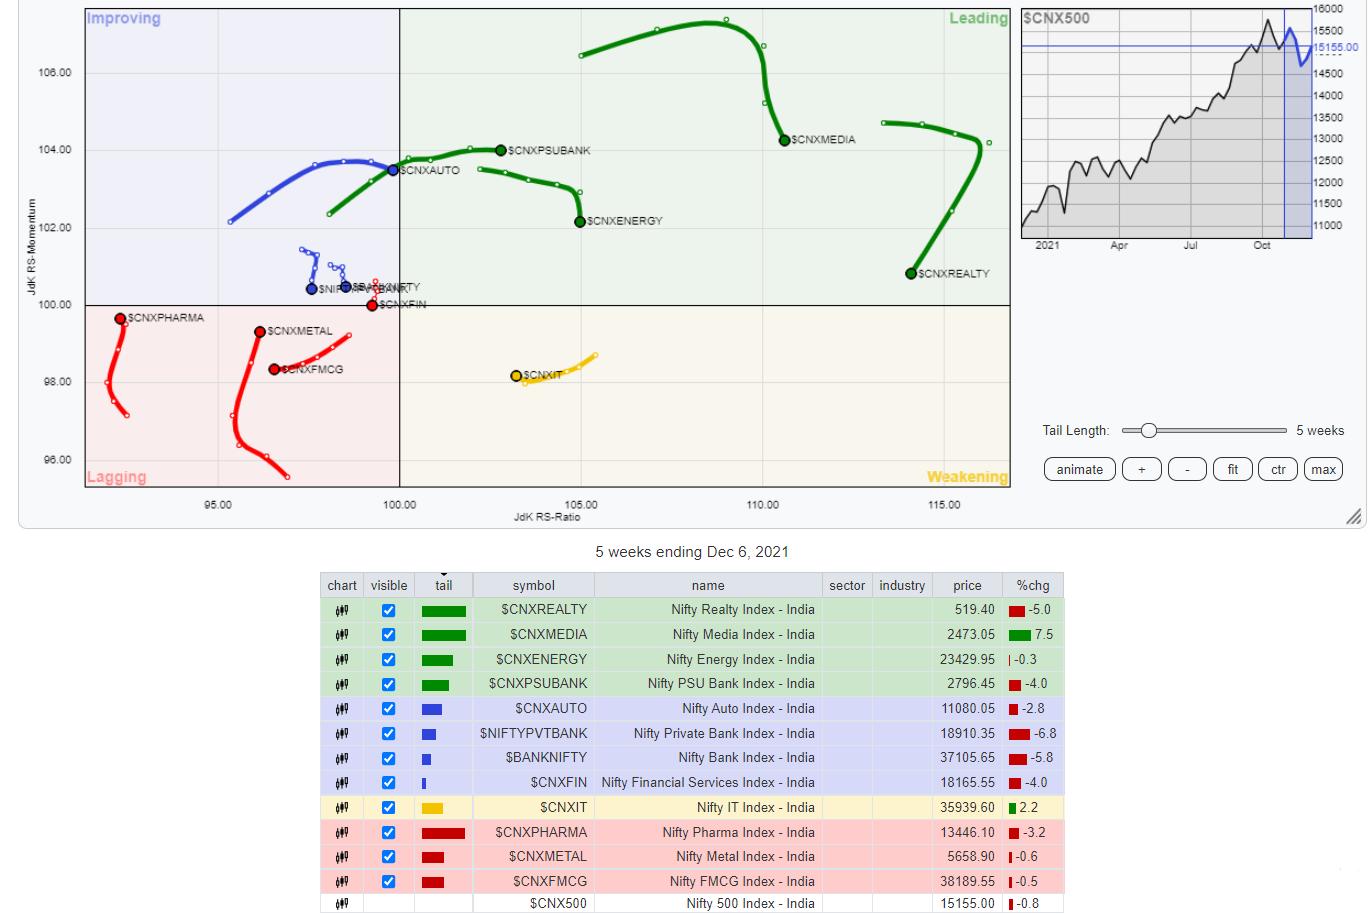
The analysis of Relative Rotation Graphs (RRG) shows NIFTY Media inside the leading quadrant along with the PSU Bank Index, which is also firmly placed inside the leading quadrant. These groups are likely to continue to relatively outperform the broader markets. The Energy, Realty, PSE, Infrastructure and Midcap 100 Indexes are also inside the leading quadrant. However, they appear to be slightly slowing down on their relative momentum. They may continue to relatively outperform the broader markets as well, but may do so on a stock-specific basis.
The NIFTY IT Index and the Small Cap Index are inside the weakening quadrant. However, they are rotating northeast and improving on their relative momentum as well. It is only the NIFTY Consumption Index that is rolling towards the lagging quadrant.
The NIFTY FMCG is inside the lagging quadrant. However, it appears to have begun its consolidation process. The NIFTY Pharma and Metal Indexes are inside the lagging quadrant as well, but appear to be sharply improving their relative momentum. They are in the process of completing their consolidation phase.
The improving quadrant has NIFTY Bank, which appears to be paring its relative momentum. Apart from that, NIFTY Auto and NIFTY Financial services are also placed inside the improving quadrant.
Important Note: RRG™ charts show the relative strength and momentum for a group of stocks. In the above Chart, they show relative performance against NIFTY500 Index (Broader Markets) and should not be used directly as buy or sell signals.
Milan Vaishnav, CMT, MSTA
Consulting Technical Analyst
www.EquityResearch.asia | www.ChartWizard.ae
- For Premium Equity Portfolio Advisory on Indian Stocks, Click Here.
- Alpha-generating actionable investment ideas on the US and UK Equities, Click Here.
- For International Commodities like Gold, Crude Oil and EURUSD/GBPUSD pairs, Click Here.


