In the previous weekly note, it was mentioned that it was just the short covering that had fueled the rally over the past two weeks. The NIFTY had piled up over 1100 points in the two weeks before this one; there were clear signs of some impending consolidation at that point in time. In line with that analysis carried out, NIFTY spent the past five sessions in a much narrower range as it tried to consolidate at present levels. The NIFTY oscillated in a 436-point range, finally ending the week on a modestly negative note. While continuing to resist key resistance points on both weekly and daily charts, the headline index closed with a net weekly gain of 134.05 points (-0.78%).
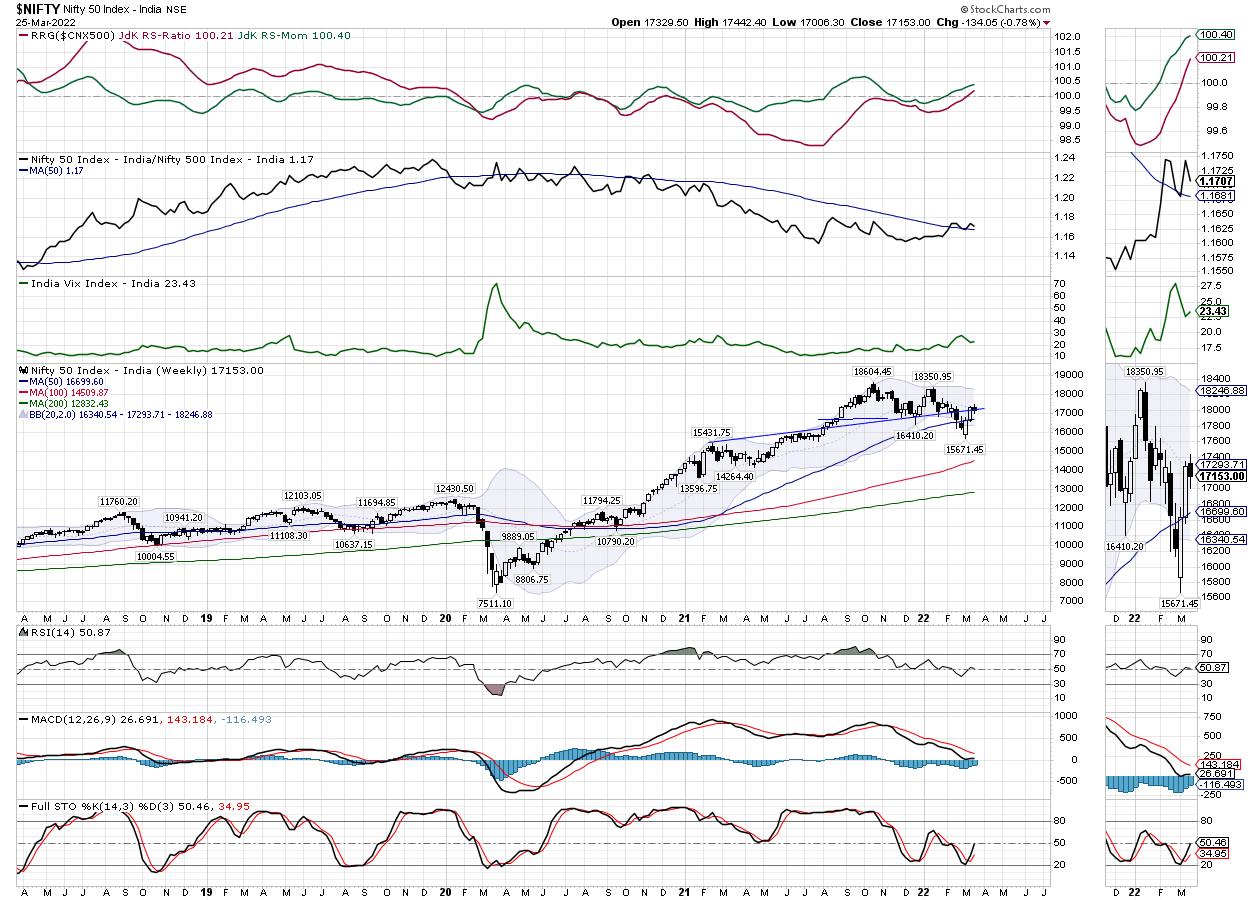
On the daily charts, the NIFTY has resisted the 100-DMA and the 50-DMA. On the weekly charts, it has failed to penetrate the 20-Week MA, which presently stands at 17293. For the coming week, the weekly options data suggests the likely trading range of 17000-17500, as these points hold maximum Put OI and the Call OI respectively. In other words, the markets will continue to consolidate and oscillated in this zone; a directional bias will be established only if the NIFTY moves above 17500 or slips below the 17000 levels. No sustainable trending move will occur in the present zone; just like the previous week, the zone of 17000-17500 needs to be crucially watched.
The coming week is likely to see the levels of 17350 and 17500 acting as potential resistance points. The supports come in at the 17000 and 16835 levels.
The weekly RSI is 50.85; it remains neutral and does not show any divergence against the price. The weekly MACD is bearish and is still below the signal line. A small black body emerged on the candles; apart from this, no other formation was noticed.
The pattern analysis suggests that the levels of 17000 hold a good support area; this is also supported by the options data. Apart from this, the NIFTY is seen clinging on precariously to a support trendline; this trend line is drawn from the levels of 15431 and joins the subsequent higher tops and extends itself. The index has also failed to penetrate the 20-Week MA, which can also act as a resistance on a closing basis.
The market continues to remain in a trading zone so long as it stays between 17000-17500; no directional bias can be expected until the NIFTY is between these two levels. A firm directional bias will be established only if the NIFTY moves past 17500 or slips below the 17000 level. Until this happens, all up moves towards 17500 will invite corrective selling pressure from higher levels. The levels of 17000 are the potential support because of the 200-DMA, which stands at 17036. So, until either of the sides (upper or lower) are taken out, it is strongly suggested that all moves on the upsides should be utilized to protect profit at higher levels. While continuing to keep leverage at very modest levels, a highly cautious view is advised for the day.
Sector Analysis for the Coming Week
In our look at Relative Rotation Graphs®, we compared various sectors against the CNX500 (NIFTY 500 Index), which represents over 95% of the free float market cap of all the stocks listed.
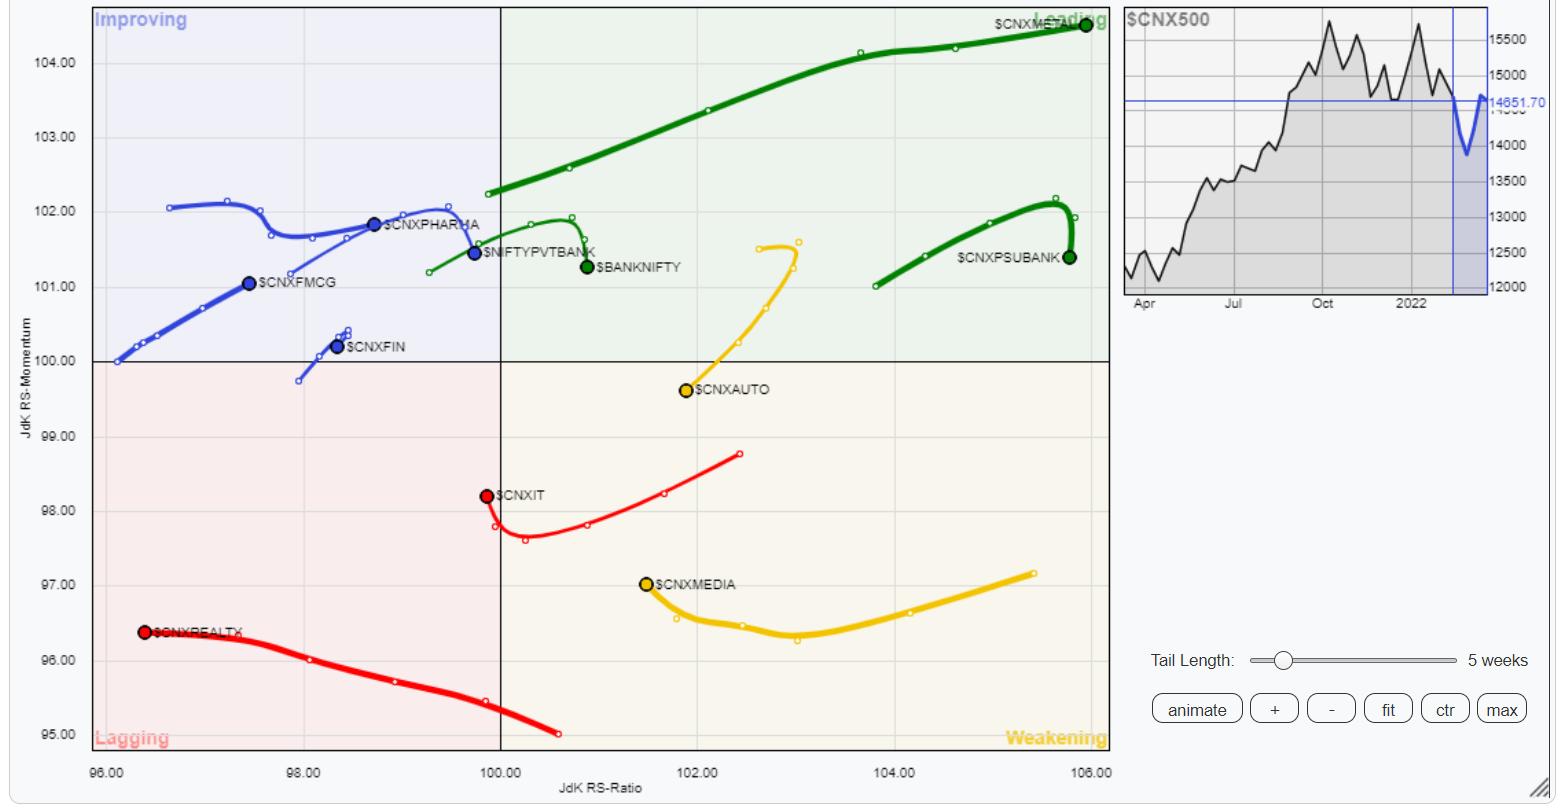
The analysis of Relative Rotation Graphs (RRG) shows that NIFTY Energy, Commodities, and the Metal Indices are firmly placed inside the leading quadrant. These groups will continue to relatively outperform the broader markets. The NIFTY Bank, PSU Bank, and the PSE indices are also inside the leading quadrant, but they appear to be consolidating while giving up on their relative momentum.
The Auto Index has rolled inside the weakening quadrant. NIFTY Media and Infrastructure indexes are also inside the weakening quadrant.
The NIFTY MidCap 100 Index is languishing inside the lagging quadrant. NIFTY IT, Consumption, and NIFTY Realty indices are also inside the lagging quadrant, but they appear to be improving on their relative front.
The NIFTY Financial Services index is inside the improving quadrant, but it is seen giving up on its relative momentum and it is seen moving towards the lagging quadrant. Apart from this, the NIFTY Pharma and FMCG indexes are inside the improving quadrant and are expected to put up a resilient show over the coming week.
Important Note: RRG™ charts show the relative strength and momentum for a group of stocks. In the above chart, they show relative performance against NIFTY500 Index (Broader Markets) and should not be used directly as buy or sell signals.
Milan Vaishnav, CMT, MSTA
Consulting Technical Analyst
www.EquityResearch.asia | www.ChartWizard.ae


