The beginning of the previous week saw the NIFTY testing important pattern resistance levels. After a strong performance on Monday, the next three days of the week were spent by the NIFTY showing a weak and corrective bais as it came off rapidly from the high levels witnessed at the beginning of the week. The last trading session on Friday remained somewhat stable wherein the NIFTY attempted a technical rebound to post some gains. But speaking on a larger note, the markets consolidated on the expected lines. After oscillating back and forth in a 514-point range, the NIFTY ended with a marginal gain of 113.90 points (+0.64%) on a weekly basis.
The coming week is a short 3-day week with Thursday and Friday being trading holidays on account of Dr. Babasaheb Ambedkar/Mahavir Janayti and Good Friday. In this short week, there are all chances that the NIFTY stays in a capped range, shows limited upsides, and does not show any runaway up move. The weekly options data show high call writing activities between 17800-18000 levels; this means that there are very few chances of the NIFTY moving past this zone in the next week. The downsides too may be limited; the NIFTY is likely to continue to stay in a defined consolidation range.
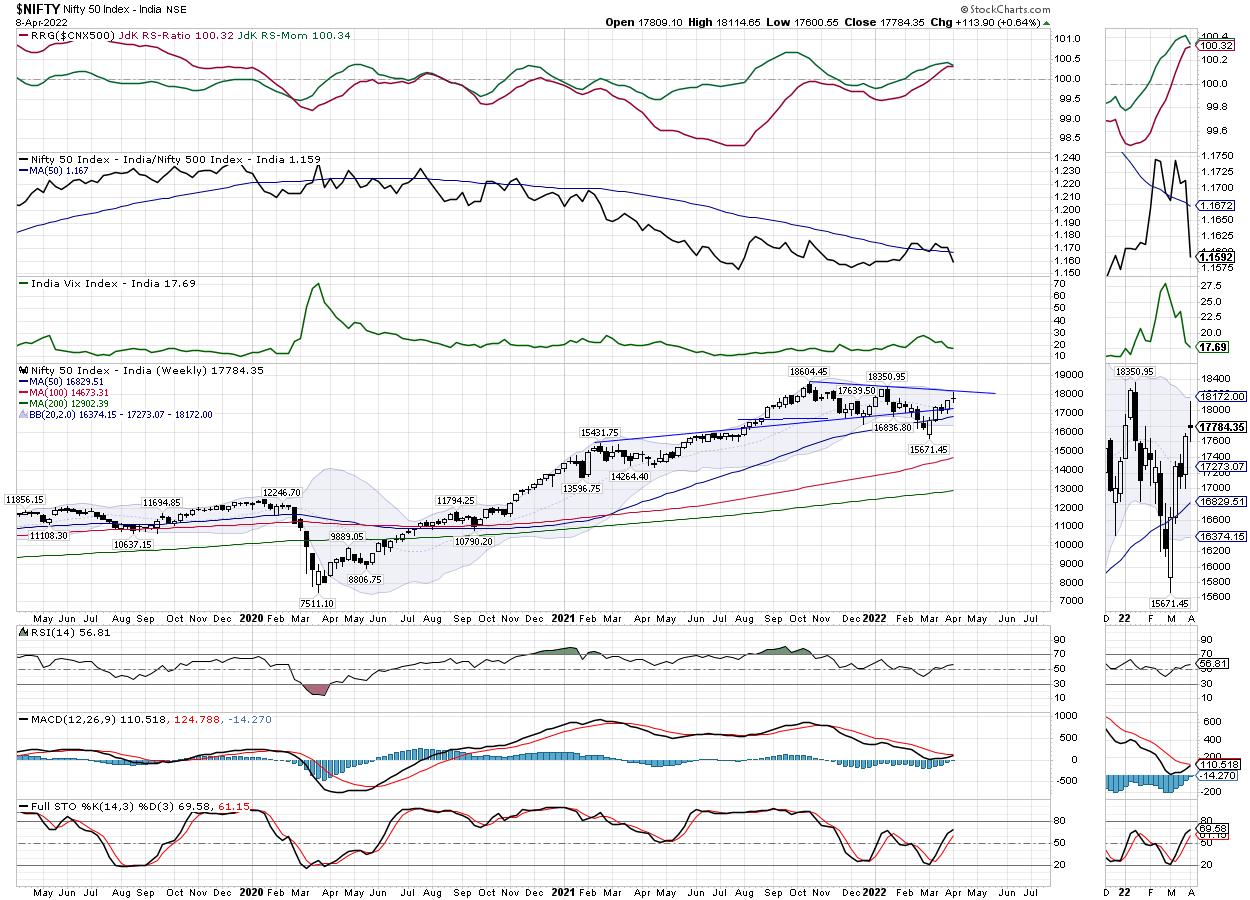
Volatility came off a bit; INDIAVIX declined by 4.05% to 17.69 on a weekly basis. The coming week is expected to see the levels of 17880 and 18000 playing out as strong resistance points; the supports come in at 17680 and 17550 levels.
The weekly RSI is 56.80; it stays neutral and does not show any divergence against the price. The weekly MACD is bearish and below the signal line. However, the narrowing slope of the histogram suggests that the indicator may show a positive crossover in the coming days.
A Spinning Top occurred on the candles. A spinning top occurs when there is little difference between the opening and the closing levels of the bar; this denotes the tentative and indecisive behavior of the market participants. This Spinning Top is almost a Doji given the very little difference between the opening and the closing levels of the Index.
The pattern analysis suggests that though the NIFTY is now above all the key moving averages, it has resisted the falling trend line resistance. This trend line is drawn from the high point of 18604 and joins the subsequent lower tops.
All and all, given the short and truncated trading week, any runaway move in the markets is highly unlikely; in fact, the markets are expected to continue exhibiting a tentative and cautious mood throughout the week. With Thursday being a holiday, the weekly options expiry would take place on Wednesday and this too will influence the trade. It is recommended that the market participants must stay light on positions; so long as the NIFTY is below the 18000 levels, it remains highly vulnerable to profit taking bouts from higher levels.
Sector Analysis for the coming week
In our look at Relative Rotation Graphs®, we compared various sectors against CNX500 (NIFTY 500 Index), which represents over 95% of the free float market cap of all the stocks listed.

The analysis of Relative Rotation Graphs (RRG) shows that the coming shortened week is likely to belong to the defensive stocks. NIFTY Metals and the Commodities index stay in the improving quadrant; these groups are likely to relatively outperform the broader NIFTY500 index. Apart from this, Energy, PSE, and Banknifty are also inside the leading quadrant. However, they are seen giving up on their relative momentum.
NIFTY Auto index has rolled inside the weakening quadrant. It may continue to relatively underperform the broader markets. On the other hand, the NIFTY IT has also rolled inside the weakening quadrant, but it has rolled from the lagging quadrant. Given the rapidly improving relative momentum of the IT index, this group may further strengthen its relative performance against the broader markets. NIFTY Media and the Services Sector index also remains in the weakening quadrant.
NIFTY Financial Services index has rolled inside the lagging quadrant. NIFTY Midcap 100 and the Realty Indices are also inside the lagging quadrant; they are seen improving their relative momentum.
NIFTY Consumption has rolled inside the improving quadrant. Along with Pharma and the FMCG pack, the consumption space may also offer resilient performance going ahead from here.
Important Note: RRG™ charts show the relative strength and momentum for a group of stocks. In the above Chart, they show relative performance against NIFTY500 Index (Broader Markets) and should not be used directly as buy or sell signals.
Milan Vaishnav, CMT, MSTA
Consulting Technical Analyst
www.EquityResearch.asia | www.ChartWizard.ae


