The entire week that went by kept the markets under a strong bear grip; all five trading sessions ended on a negative note. The markets continued to witness gaps on the downside; saw some intermittent short-covering but ultimately traded with a negative undertone. The trading range remained more or less similar to the week before this one; against the trading range of 790-points in the previous week, this week saw the NIFTY oscillating in a 668.80 points range. While the bearish undertone refused to go away, this saw the benchmark NIFTY50 ending with a net loss of 629.10 points (-3.83%) on a weekly basis.
In the last two weeks, i.e., 9 sessions, NIFTY has lost 1320.40 points. It is interesting to note that in 8 out of 9 sessions, the NIFTY has added the Open Interest along with the decline. This means that the markets have added a lot of shorts in the system; also, it is interesting to note that the markets have not given any technical pullback which would otherwise happen in such cases. From the technical perspective, NIFTY has approached minor double bottom support on the weekly charts. The coming week would be crucial to see if the NIFTY is able to defend the 15500-15650 support zone.
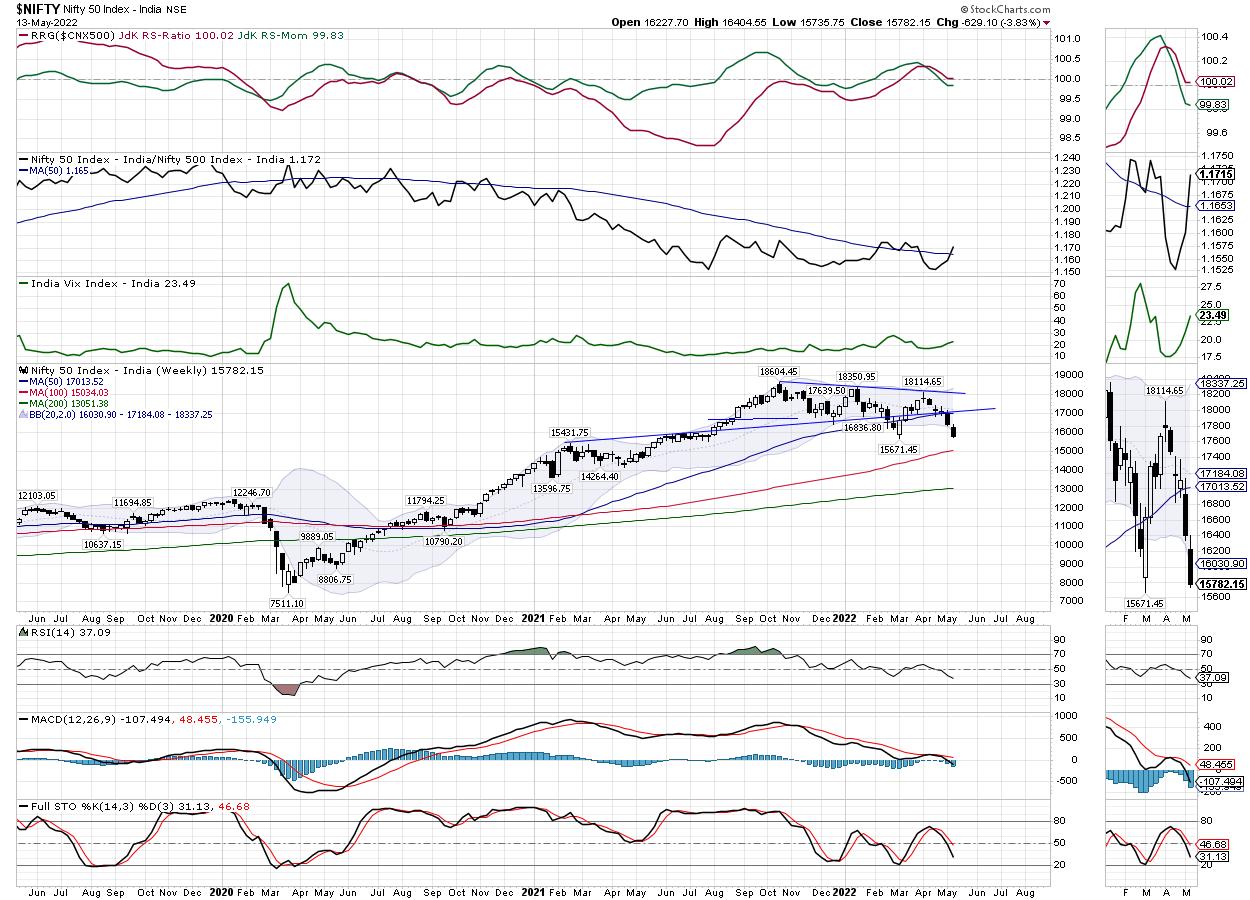
The coming week is likely to see the levels of 15890 and 16000 as potential resistance points. The supports come in at 15650 and 15500 levels.
The RSI is 37.08; it has marked a new 14-period high which is bearish; there is a mild bearish divergence on the charts as the price has not marked a new 14-period high. The weekly MACD is bearish and trades below the signal line.
A large black candle appeared on the charts; it showed a strong directional consensus of the market participants on the downside.
Volatility continued to surge; INDIAVIX 10.52% to 23.49 on a weekly note.
From the pattern analysis of the weekly chart, it appears that the NIFTY has approached minor double bottom support. Given this pattern, it would be crucial to see if the NIFTY is able to defend the 15500-15650 support zone over the coming days.
All in all, there are chances that the global markets may also attempt to find some stability; this will also help the domestic market to take some breather from the unabated weakness that it has been displaying over the past two weeks. Even if there is some more weakness, it is strongly recommended to avoid creating shorts at current or lower levels. The markets are now due to technical pullback which remains overdue and imminent. Just like the week before this one, it is reiterated that one must continue to stay highly stock-specific in approach and adopt a positive but cautious outlook towards the markets for the immediate near term.
Sector Analysis for the coming week
In our look at Relative Rotation Graphs®, we compared various sectors against CNX500 (NIFTY 500 Index), which represents over 95% of the free float market cap of all the stocks listed.

The analysis of Relative Rotation Graphs (RRG) shows the Energy Index, PSE, Commodities, and Infrastructure Index are all showing improvement in the relative momentum while staying in the leading quadrant. Apart from this, the FMCG and the Consumption index have also rolled inside the leading quadrant. All these groups are likely to show strong relative outperformance against the broader NIFTY500 Index. NIFTY Pharma also is inside the leading quadrant; it appears to be slowing down a bit.
NIFTY PSU Bank Index continues to languish inside the weakening quadrant. The NIFTY Media Index is also inside the weakening quadrant, but it is seen vertically improving its relative momentum against the broader markets.
The NIFTY Bank, NIFTY Services Sector Index, Auto, and the IT Index stay in the lagging quadrant. These groups are likely to relatively underperform the general markets.
The NIFTY Realty Index is inside the lagging quadrant as well; however, it is also seen improving on its relative momentum against the broader markets. NIFTY Midcap 100 Index has rolled inside the improving quadrant; it is likely to improve its relative performance going ahead from here.
Important Note: RRG™ charts show the relative strength and momentum for a group of stocks. In the above Chart, they show relative performance against NIFTY500 Index (Broader Markets) and should not be used directly as buy or sell signals.
Milan Vaishnav, CMT, MSTA
Consulting Technical Analyst
www.EquityResearch.asia | www.ChartWizard.ae


