In a week that was truncated due to a trading holiday on account of Eid, the Indian equity markets traded weakly for the most part, ending in the red for three out of four sessions. Among these, the last trading day on Friday remained particularly weak. The markets also witnessed a wider-than-usual trading range; the NIFTY oscillated in a 790-point range before ending with a deep cut. The markets also digested two rate hikes and an increase in volatility as well. The headline index NIFTY closed with a net loss of 691.30 points (-4.04%) on a weekly basis.
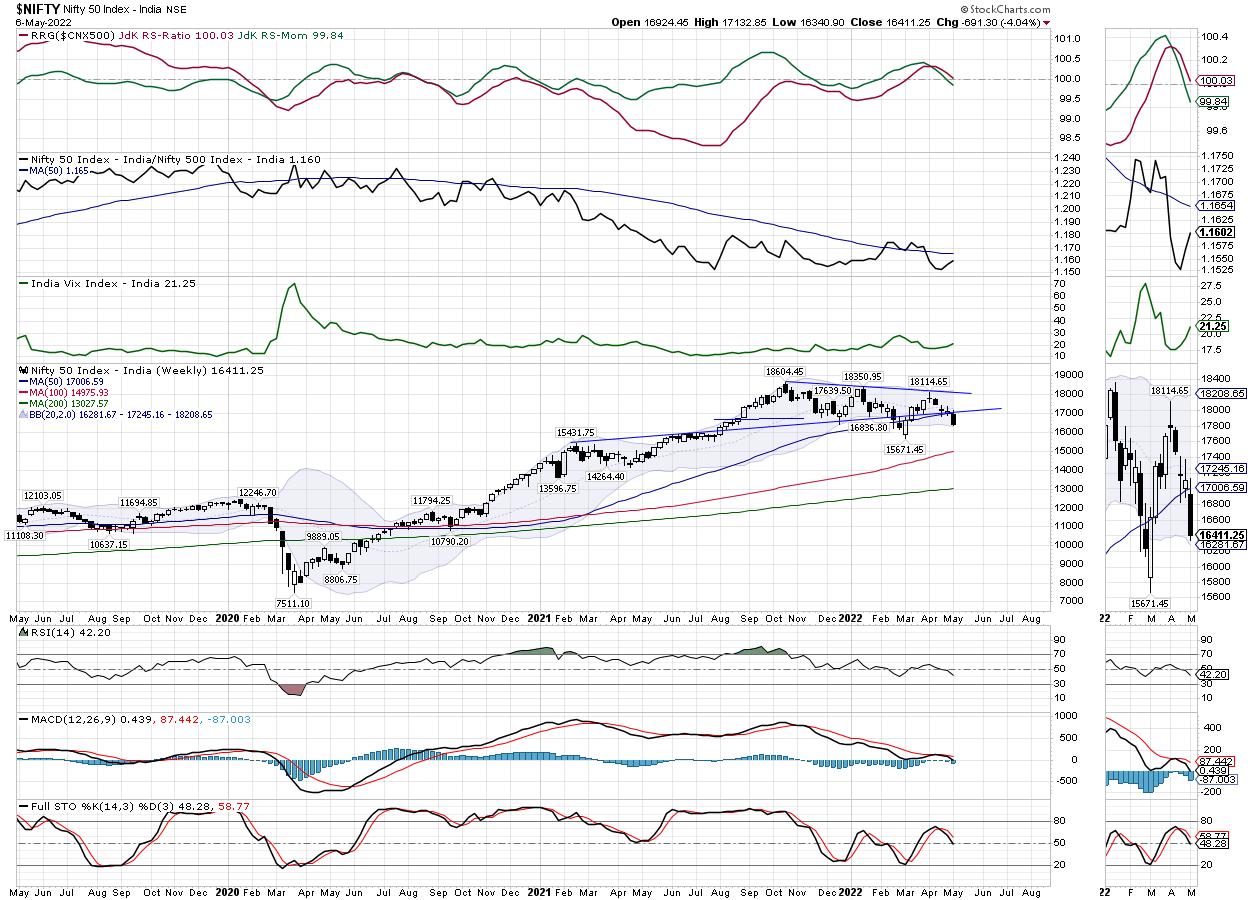
The past four trading sessions were particularly damaging from a technical standpoint. The markets absorbed two rate hikes; one from the Federal Reserve, which was scheduled and expected, and the other on the domestic front, that being where RBI railed the repo and the reverse repo rate ahead of schedule. While reacting negatively to this, the NIFTY also violated and closed below the 50-Week MA, which presently stands at 17008. It also ended up breaching a pattern trendline support. In the process, the NIFTY has dragged its immediate resistance levels even lower to 17000. If any pullback occurs, the markets will face stiff resistance at this point.
The volatility also increased. The INDIA VIX surged by 9.46% to 21.25 on a weekly note. The coming week may see the markets attempting to gain some respite and stability. The levels of 16650 and 16900 will act as resistance points, while the supports come in at the 16310 and 16160 levels. The trading range over the coming week is expected to stay wider than usual.
The weekly RSI is 40.26; it shows a bullish divergence against the price. While the NIFTY made a fresh 14-period low, the RSI did not, which led to a bullish divergence of the RSI against the price. The weekly MACD is bearish and trades below its signal line.
A large black candle appeared on the charts. It not only demonstrated the directional consensus on the downside, but it also added to the credibility of the resistance of the 17000 levels in the form of a pattern violation, as well as the 50-week MA.
Going ahead from here, we may see the markets trying to stabilize themselves over the next five trading sessions, but, at the same time, any pullback that may happen will remain limited in its extent. Over the past few trading sessions, the markets have piled up large short positions in the system, as indicated by the derivatives data. It is strongly recommended that shorts must be strictly avoided at current levels. Even in case of any weakness over the coming days, these very existing shorts can fuel a strong short-covering rally. Such technical pullback, even if it is fueled by mere short covering, is imminent and overdue. While continuing to stay with low beta defensive stocks, a cautiously positive outlook is advised for the day.
Sector Analysis for the Coming Week
In our look at Relative Rotation Graphs®, we compared various sectors against CNX500 (NIFTY 500 Index), which represents over 95% of the free float market cap of all the stocks listed.
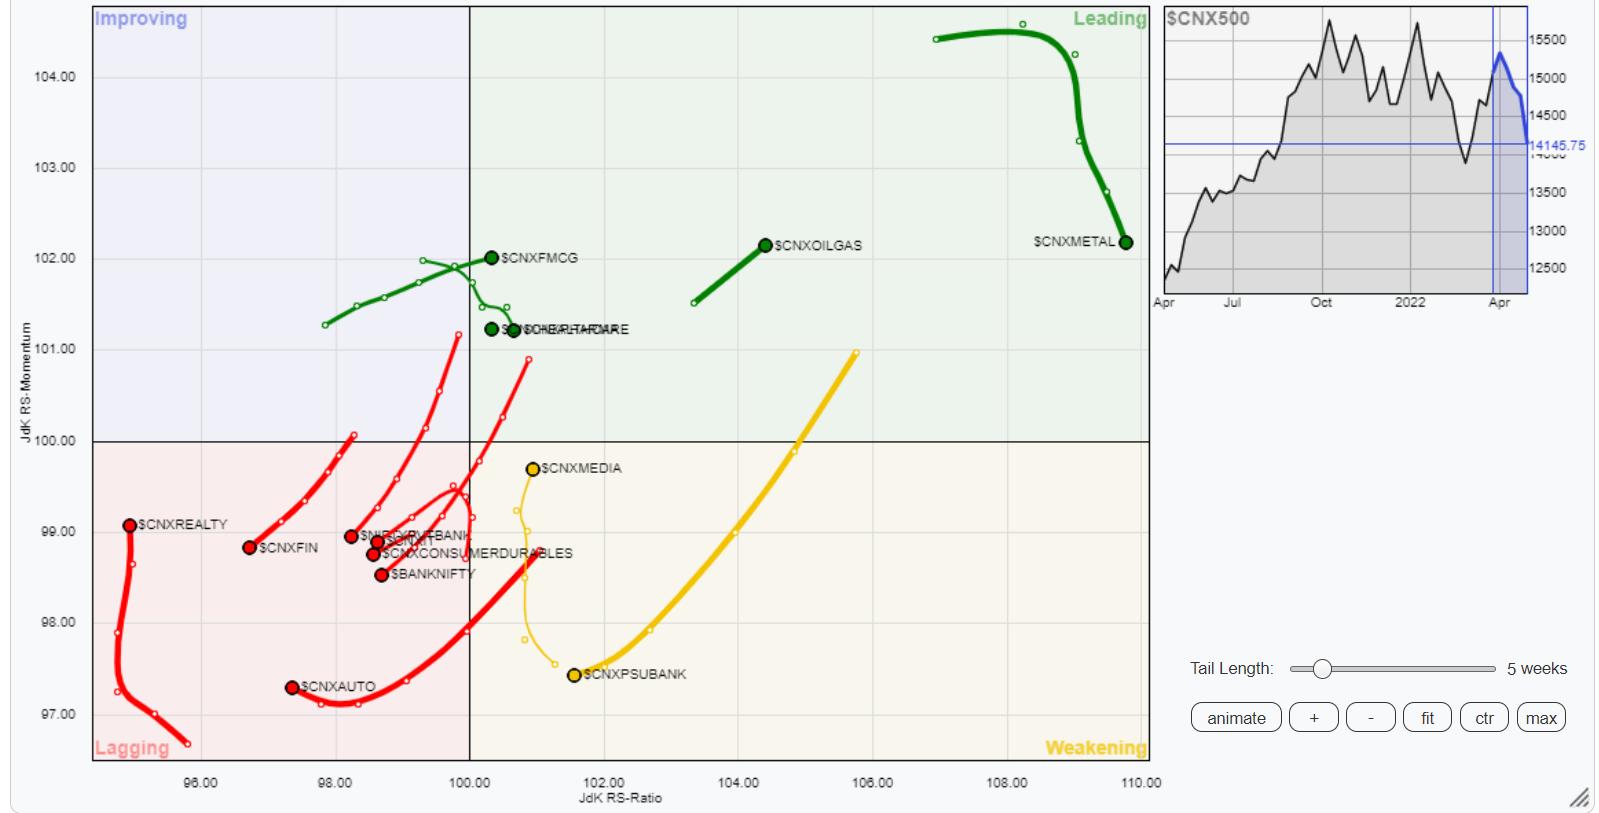
The analysis of Relative Rotation Graphs (RRG) shows the sectors in the leading quadrant, including Energy, PSE, Infrastructure, Commodities, Pharma and Metal, will continue to put up a good show and will demonstrate good relative outperformance against the broader NIFTY500 Index.
The PSU Bank Index and the Media Index are inside the weakening quadrant. They may continue to show good performance on an individual note, but the relative performance may remain compromised.
The IT Index, Services Sector, BankNifty, Financial Services and Auto Indexes are inside the lagging quadrant and are clearly set to relatively underperform the markets. On the other hand, the Realty Index and the Midcap 100 Index are also inside the lagging quadrant, but they appear to be improving on their relative momentum against the broader markets.
The NIFTY FMCG and Consumption indexes are inside the improving quadrant and may put up a good show over the coming days.
Important Note: RRG™ charts show the relative strength and momentum for a group of stocks. In the above Chart, they show relative performance against NIFTY500 Index (Broader Markets) and should not be used directly as buy or sell signals.
Milan Vaishnav, CMT, MSTA
Consulting Technical Analyst
www.EquityResearch.asia | www.ChartWizard.ae


