During a week that remained largely bearish, the Indian equity markets retraced and ended on a negative note. Unlike the previous week, this time, over the past five sessions, the NIFTY did not oscillate in either direction. Instead, it just remained unilaterally bearish for the major part of the week. The index has ended up violating important support; this has taken it back inside the large trading range, with the broader technicals remaining weak. The index had a 438-point trading range. While not showing any major strength on the larger timeframe charts, the headline index closed with a net loss of 382.50 points (-2.31%) on a weekly basis.
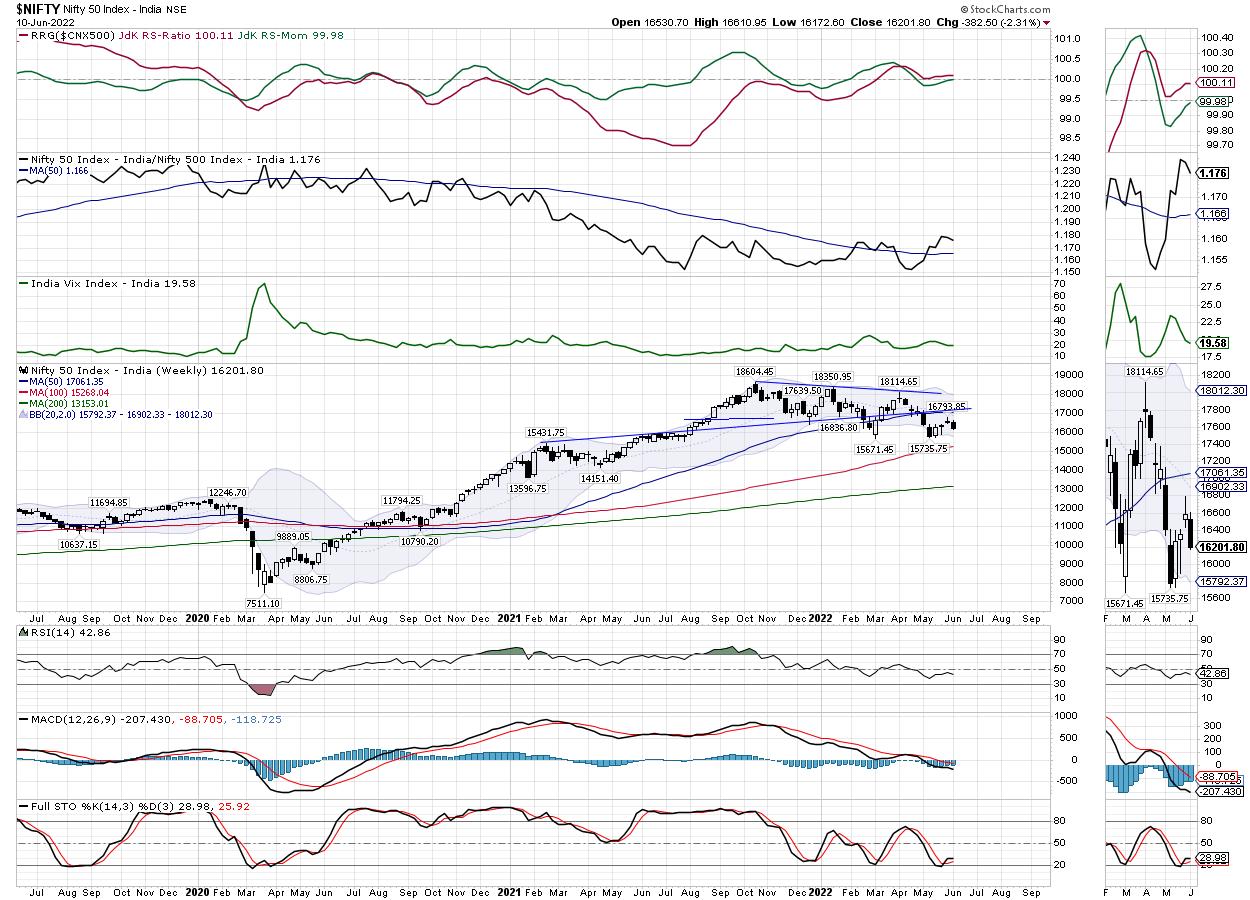
From a technical standpoint, Friday's session has inflicted some damage on the technical structure of the NIFTY. On the daily timeframe, the index has again slipped below the short-term 20-DMA, which presently stands at 16315. Apart from this, the NIFTY also trades below all three key Moving Averages on the daily timeframe charts. Coming back to the weekly technical structure, NIFTY has failed to move past the 20-Week MA, which presently stands at 16902. With the 50-Week MA at 17063, the zone of 16900-17065 has become a very stiff resistance area for the index.
The most immediate resistance point for the NIFTY remains at 16400, as the index has slipped below this level. For the coming week, the markets may find resistance at 16400 and 16665 levels. On the lower side, supports exist at 16000 and 15840 levels.
The weekly RSI is 42.85; it remains neutral and does not show any divergence against the price. The weekly MACD is bearish and remains below the signal line. A black-bodied candle appeared on the charts, which showed a bearish directional consensus of the market participant; apart from this, no other formations were seen on the charts.
The pattern analysis shows that, on the weekly charts, the NIFTY trades below the 50-week MA and the 20-week MA are in close proximity to each other, at 17063 and 16902 respectively. This makes the zone of 16900-17065 a strong resistance area for the Index. Besides this, the most recent move has dragged the NIFTY back inside the 1000-odd points trading range, which has the 15700 as its pattern support area. This means that, so long as the NIFTY stays between 15700-17000; it will not have any definite directional bias and we will see the markets oscillate back and forth in this wide trading range.
The derivatives data shows that long unwinding has happened in the markets. The NIFTY current month futures have shed over 2.59 lakh shares, or 2.22% in net Open Interest. The decline in OI has come with the decline in NIFTY; this hints at long unwinding at higher levels. Importantly, this may not lead to any immediate fall in the markets, but there are possibilities that all up moves may get sold into. It is strongly recommended that you keep leveraged exposures curtailed; it would be rewarding to stay exposed to pockets showing strong/improving relative strength. Over the coming week, sectors like FMCG, Consumption, and select financials may post good performances over the coming days.
Sector Analysis for the Coming Week
In our look at Relative Rotation Graphs®, we compared various sectors against CNX500 (NIFTY 500 Index), which represents over 95% of the free float market cap of all the stocks listed.
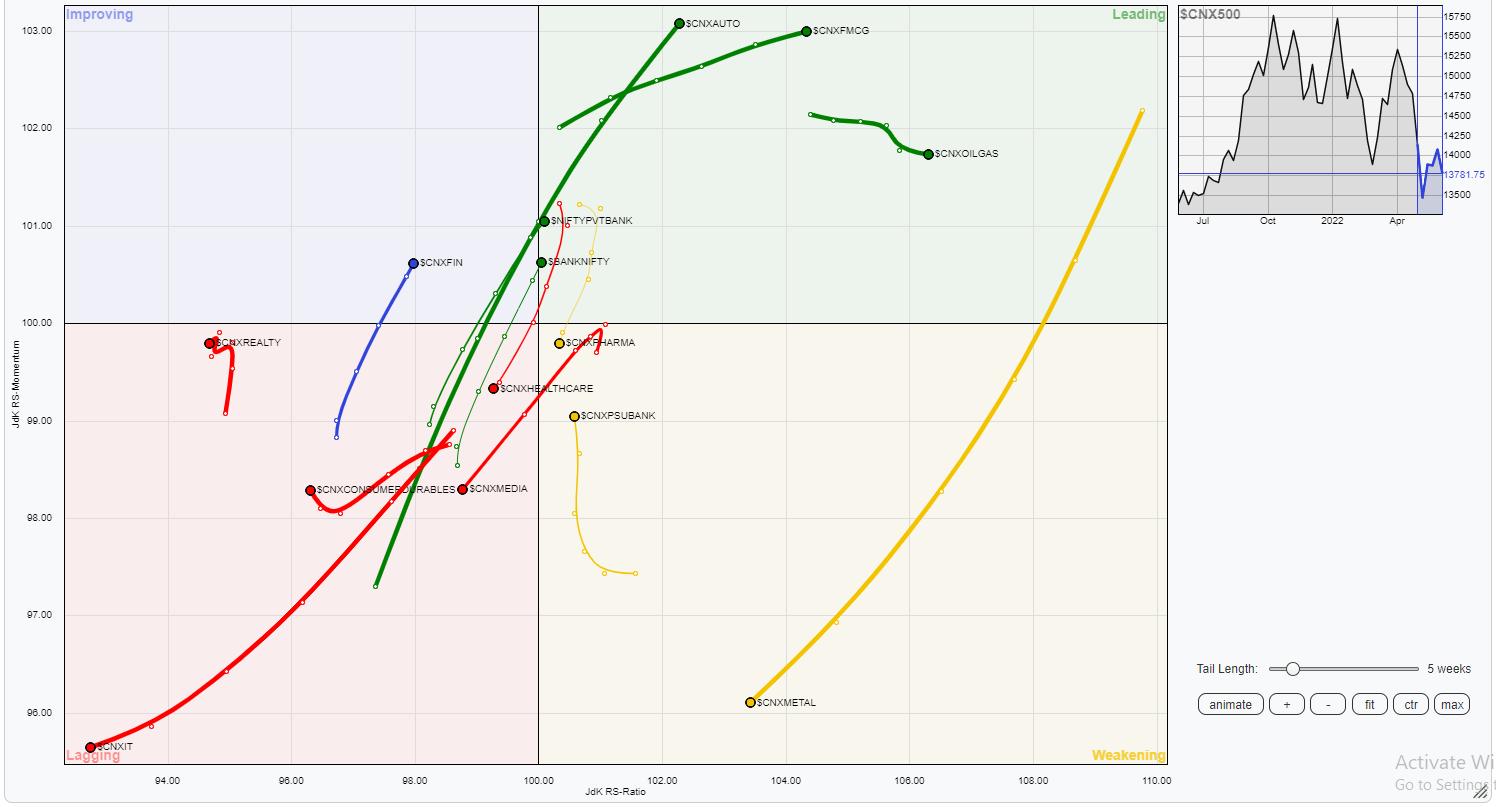
The analysis of Relative Rotation Graphs (RRG) shows some mixed setup; while few of the defensive pockets are showing improvement in the relative strength and momentum, a few other high beta groups are also showing possibilities of resilient performance from them. The Metal and Commodities indexes are inside the weakening quadrant, while the Media index is seen languishing inside the lagging quadrant. These groups are likely to post relative underperformance against the broader markets. The NIFTY Pharma index has also rolled inside the weakening quadrant.
The NIFTY FMCG, Consumption, Auto, Infrastructure, PSE and Energy groups are inside the leading quadrant. They are expected to put up relative outperformance against the broader NIFTY500 Index.
The NIFTY Services sector index, the Realty index and the IT index are also seen languishing inside the lagging quadrant. Some isolated stock-specific performance may be seen, but, overall, relative underperformance may continue to persist.
While the NIFTY Financial Services index is still in the improving quadrant, BankNifty has rolled inside the leading quadrant.
Important Note: RRG™ charts show the relative strength and momentum of a group of stocks. In the above Chart, they show relative performance against NIFTY500 Index (Broader Markets) and should not be used directly as buy or sell signals.
Milan Vaishnav, CMT, MSTA
Consulting Technical Analyst
www.EquityResearch.asia | www.ChartWizard.ae


