In what remained one of the worst-performing weeks for the Indian equities in the recent past, the benchmark indices suffered deep losses before ending the week on a very fractured note. All five sessions over the past five days ended in the negative; at no point in time did the markets ever show any intention to hold ground except on Friday, when the NIFTY came off its lows but still ended on a negative note. The trading range this week remained much wider than the previous one; the index oscillated 702 points before ending with a net loss of 908.30 points (-5.61%) on a weekly basis.
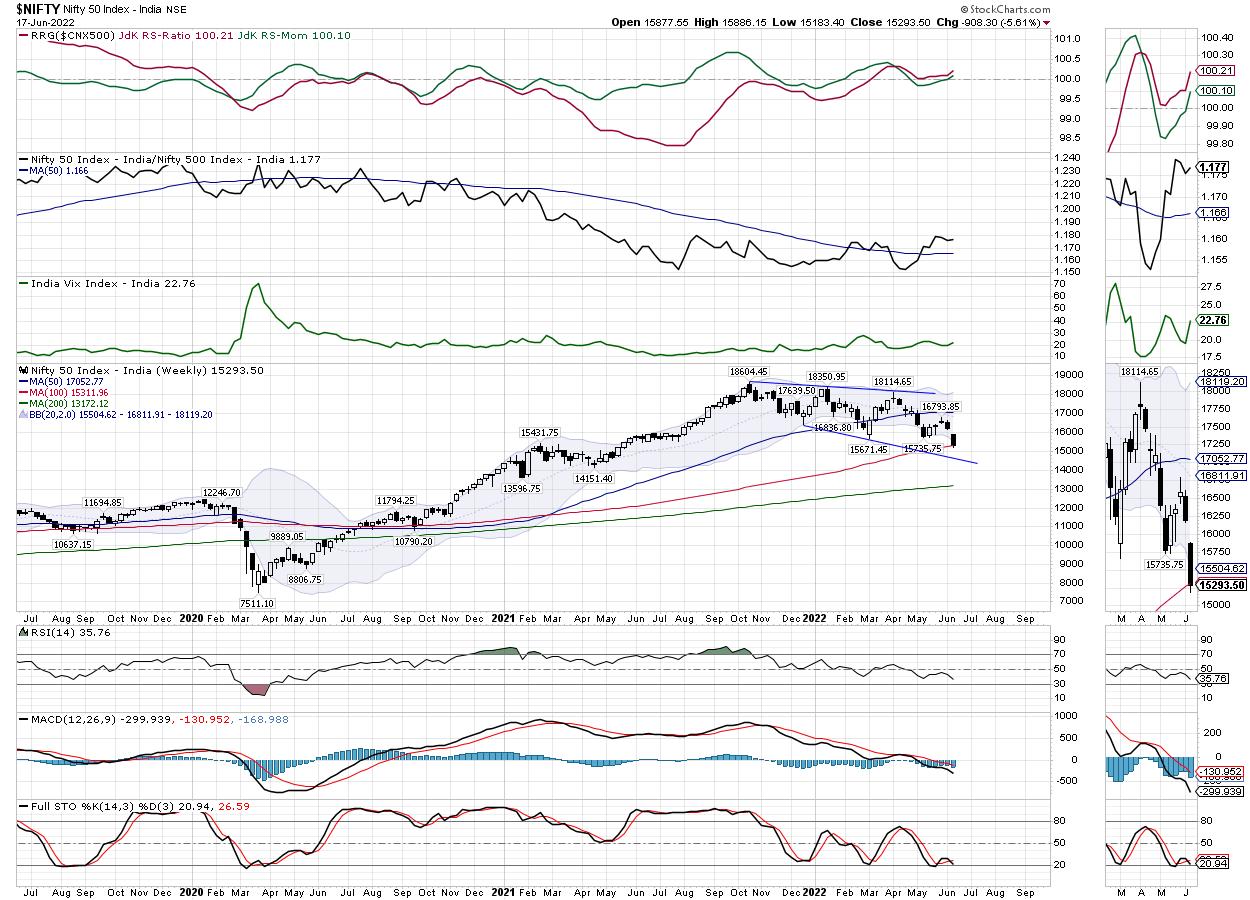
The previous few days have been damaging for the markets from a technical perspective. After bouncing off from 15700 once after respecting double bottom support, the NIFTY has ended up violating the very same support on its way down. By doing this, from the most immediate short-term, the NIFTY has dragged its resistance levels further down to 15700. If and when a technical pullback occurs, it will find strong resistance at the 15700 levels. Apart from this, the index has also ended up creating a 300-point gap between the 15900-16200 levels. This makes the entire 500-point zone of 15700-16200 a very stiff resistance area for the markets.
Given the fact the markets are oversold on the short-term charts, there could be potential for the indices to stage a technical pullback. The levels of 15430 and 15590 are likely to act as potential resistance points. The supports come in at 15090 and 14910 levels.
The weekly RSI is 35.75; it has marked a fresh 14-period low, which is bearish. The RSI remains neutral and does not show any divergence against the price. The weekly MACD is bearish and trading below the signal line.
A large black body emerged on the candles; this reflected the strong directional consensus of the markets on the downside. Apart from this, an equally important formation, that of falling window, occurred on the candles. Such a formation is a result of a gap on the downside; it usually resolves with the move in the direction of the trend.
The pattern analysis of the weekly chart shows that, following a most recent pullback on the upside after taking support at 15700, the NIFTY failed to move past the 50- and 20-Week MA, which presently stands at 17054 and 16811 respectively. While it violated these supports, it has tested the 100-Week MA, which presently stands at 15312. This level, i.e. 100-Week MA, is likely to act as a support for the markets on a closing basis. Even if there is a minor violation of this point, there is a greater possibility of the NIFTY taking support at this point on a closing basis.
The derivatives data present a mixed set of cues; the highest Call OI exists at the 15000 level, while maximum Put OI is seen concentrated at 15700. These figures are, of course, subject to change. Though there is a higher chance of the markets trying to find a foot for themselves and form a potential point of reversal, it would be wise to wait for this confirmation before trying to bargain hunt for stocks. That being said, it is strongly recommended you avoid creating shorts, as the NIFTY is oversold in the near-term and is prone to technical pullback. Dips, if any, must be utilized to pick up good-quality stocks while keeping the overall leveraged position at modest levels.
Sector Analysis for the Coming Week
In our look at Relative Rotation Graphs®, we compared various sectors against CNX500 (NIFTY 500 Index), which represents over 95% of the free float market cap of all the stocks listed.
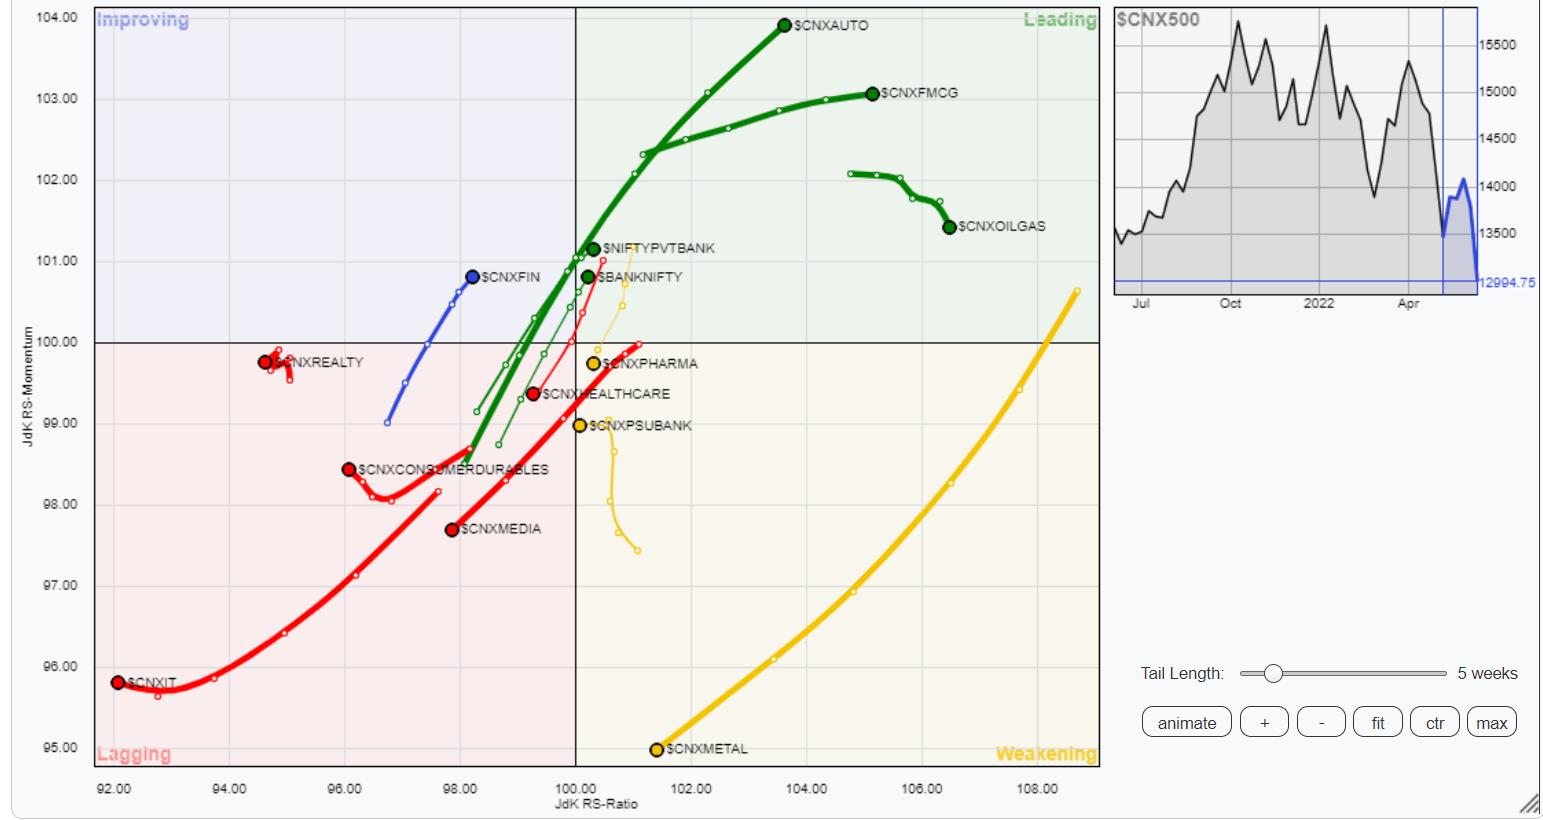
Our analysis of Relative Rotation Graphs (RRG) continues to show a mixed setup; while few defensive sectors remain in the leading quadrant, a few high-beta groups are also showing significant improvement in their relative momentum against the broader markets. The NIFTY Auto, BankNifty, Financial Services, PSE, FMCG, Infrastructure, Energy and Consumption indices are inside the leading quadrant. Out of these, PSE and Energy are seen giving up on their relative momentum, while the rest remain stable. These groups will still continue to relatively outperform the broader markets.
NIFTY Metal continues to advance southwest inside the weakening quadrant. The relative momentum is still rapidly declining for this sector. The Pharma, Commodities and NIFTY PSU Bank index also remain inside the weakening quadrant.
The NIFTY Media, Realty, Services sector and NIFTY IT continue to languish inside the weakening quadrant. The NIFTY Financial Services index is inside the improving quadrant and showing a steady improvement in its relative momentum against the broader NIFTY500 Index.
Important Note: RRG™ charts show the relative strength and momentum for a group of stocks. In the above chart, they show relative performance against NIFTY 500 Index (Broader Markets) and should not be used directly as buy or sell signals.
Milan Vaishnav, CMT, MSTA
Consulting Technical Analyst
www.EquityResearch.asia | www.ChartWizard.ae


