In the previous weekly note, we mentioned that the markets have formed a strong base for themselves; the most logical move that the markets can make is to move towards their 50-Week MA, which was then placed at 17073. The beginning of the previous week was a bit jittery, as the NIFTY had a brief corrective consolidation to start the week with; however, the last three sessions remained very strong. The markets had a little bit bigger of a trading range; it moved in a 737-point window and closed the week on a very strong note. The last three sessions had gap-up openings; the headline index closed with a strong weekly gain of 438.80 points (+2.62%). The markets also closed the month on a robust note, with NIFTY gaining 1378 points (+8.73%) for July.
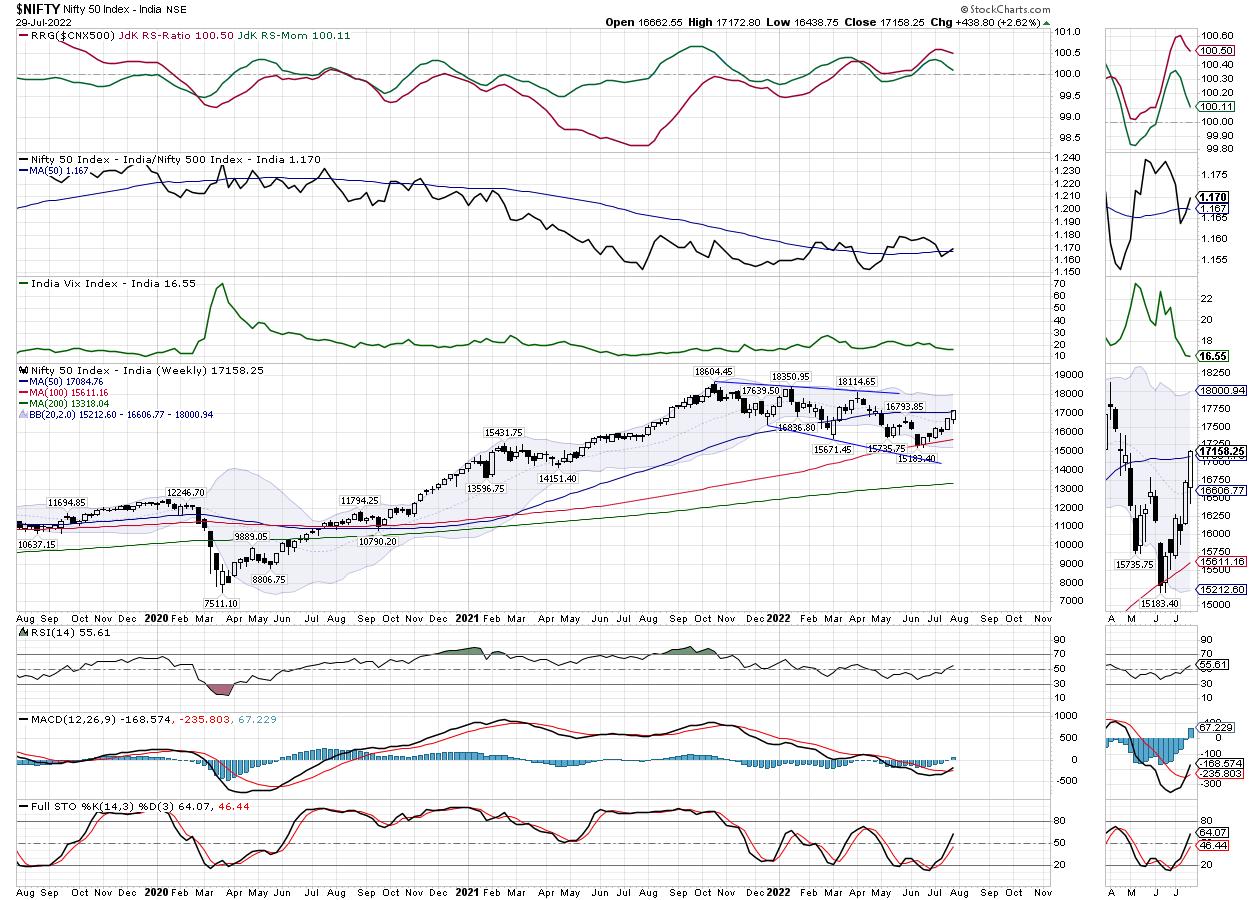
During the week, the global equity markets digested the already-discounted 75 bps rate hike that came from FOMC. The equity markets surged; India was no exception. The foundations for a strong reversal were set weeks ago when nearly all the key global markets had shown a strong bullish divergence of the lead indicators on the charts. The NIFTY has halted at the 50-Week MA, which is presently placed at 17086. There is a possibility that the markets may consolidate at current levels; the consolidation may happen in form of ranged oscillations, but the downsides may stay limited. The options data also suggest that the markets may have opened up some more room for upside; however, for this to happen, keeping the head above 17000 will be extremely crucial for the markets.
The coming week may see a stable start to the week; the levels of 17350 and 17500 are expected to act as potential resistance points. The supports come in at the 17000 and 16620 levels. The trading range for the coming week is also likely to stay wider than usual.
The weekly RSI has marked a fresh 14-period high, which is bullish; however, it remains neutral and does not show any divergence against the price. The weekly MACD has shown a positive crossover; it is now bullish and trades above the signal line.
A strong white-bodied candle appeared on the charts, this reflected the directional consensus of the market participants.
The pattern analysis of the weekly chart suggests that NIFTY has successfully marked a base for itself at the most recent lows; now, unless violated, that becomes a strong intermediate support for the markets. On the higher side, NIFTY now trades above all the three Weekly Moving Averages; it has opened up some upsides. However, to extend the up move, it would be crucial for the Index to keep its head above the 50-Week MA, which is presently placed at 17086.
The volatility remained largely unchanged; INDIAVIX lost just 0.60% on a weekly basis. Overall, in the coming week, NIFTY's price action vis-à-vis the levels of 17000 will be crucial to watch. The index may extend its up move if it stays above 17000; any slip below this will make the markets undergo some consolidation once again. We are not likely to see any particular sector dominating the landscape, but we are likely to see some highly stock-specific moves over the coming week. It is expected that, while traditionally defensive pockets like IT and Pharma may do well, some stock-specific moves from the Metals, Financials and Autos cannot be ruled out as well. It is recommended to continue staying stock-specific; avoid chasing the extended up moves and protect profits at each higher level.
Sector Analysis for the Coming Week
In our look at Relative Rotation Graphs®, we compared various sectors against CNX500 (NIFTY 500 Index), which represents over 95% of the free float market cap of all the stocks listed.
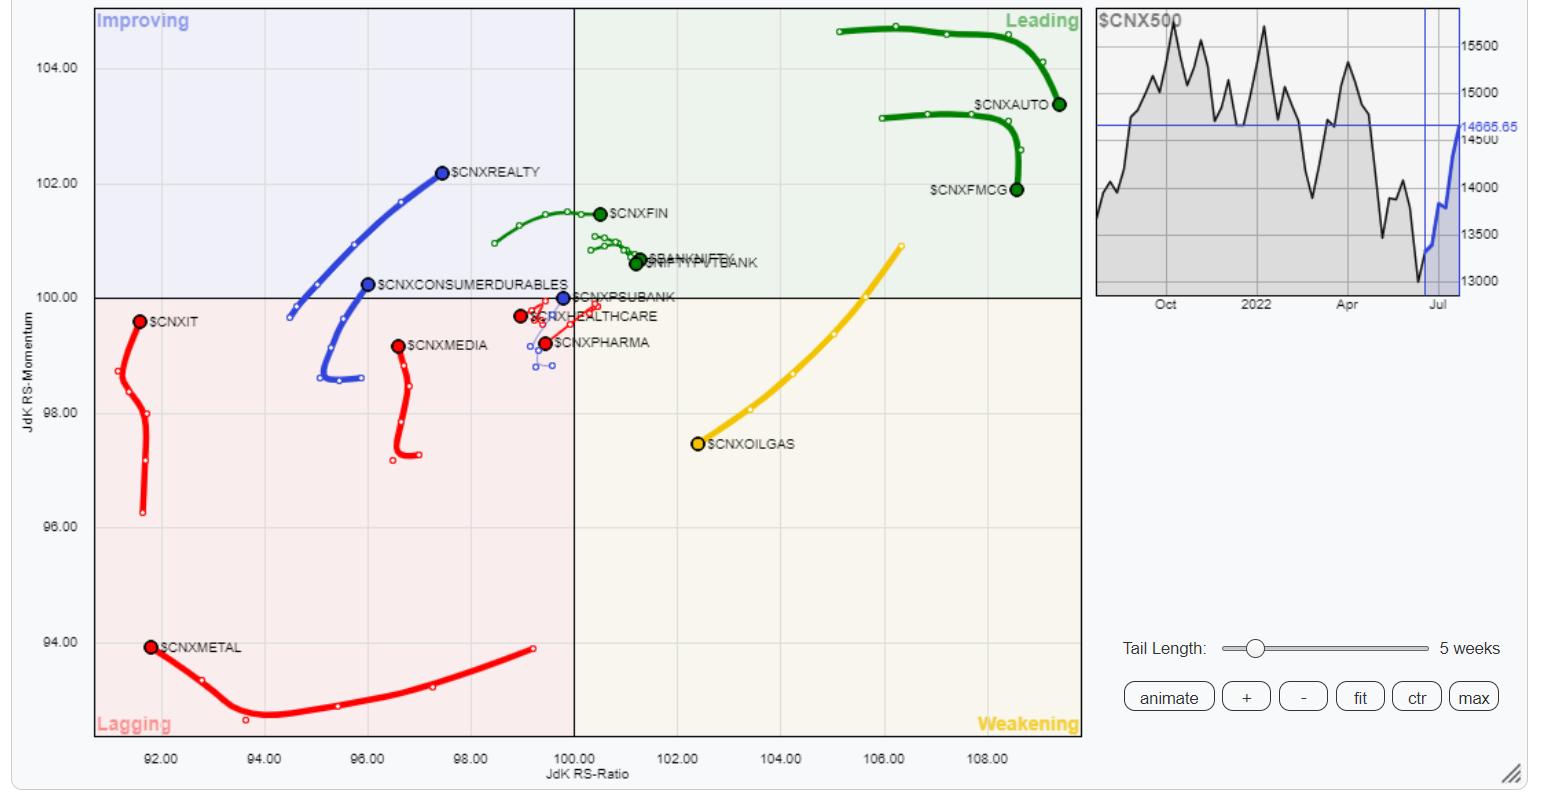
Our analysis of Relative Rotation Graphs (RRG) does not show any major changes in the sector setup that was there over the previous week. BankNifty, Consumption, FMCG, Auto and the Financial Services Index are inside the leading quadrant; they are likely to continue to relatively outperform the broader NIFTY500 Index.
NIFTY Energy, PSE, and Infrastructure indexes continue to stay inside the weakening quadrant; some isolated stock-specific shows may happen, but, on relative terms, they may continue showing decelerating momentum.
The NIFTY Metal and Commodities index appears to have started its process to complete its move, though it continues to languish inside the lagging quadrant. The NIFTY Media and IT index are seen sharply improving their relative momentum against the broader markets.
The NIFTY Pharma, Services Sector, and PSU bank indexes are seen sharply improving their relative momentum. These groups are likely to post resilient showings on relative terms over the coming week.
Important Note: RRG™ charts show the relative strength and momentum for a group of stocks. In the above Chart, they show relative performance against NIFTY500 Index (Broader Markets) and should not be used directly as buy or sell signals.
Milan Vaishnav, CMT, MSTA
Consulting Technical Analyst
www.EquityResearch.asia | www.ChartWizard.ae


