The markets had a strong week that was much on the expected lines. In the previous weekly note, it was categorically mentioned that the markets might resume their up move after a brief period of consolidation. Over the past five sessions, the markets continued to inch higher as they got stronger in the process. And with the conviction in the move, the trading range also widened as expected. Against the trading range of 390.35 points in the week before this one, the NIFTY moved 610.05 points this week as it added strength to its move. While moving past a few important levels, the headline index closed with net gains of 670.25 points (4.18%) on a weekly note.

Among a few technically important things that took place, the one was that of the NIFTY keeping its head above the crucial 16000 levels, then inching higher. In the process, the index also moved past the 20-Week MA, which stands at 16580 levels. The most logical move is likely to take the markets to their 50-Week MA, which is presently placed at 17073. Even the options data suggest the markets reaching this, as well as taking a breather as the highest Call OI is placed at this strike price. However, this being said, it must also be noted that this may not happen without a brief consolidation that is very much likely to take place.
We are entering the expiry week of the monthly derivative series, and the coming sessions are likely to stay dominated by rollover-centric activities. The coming week is likely to see the levels of 16850 and 17000 acting as potential resistance points. The supports come in at 16550 and 16435 levels. The trading range will continue to stay wider than usual.
The weekly RSI is 51.69; it remains neutral and does not show any divergence against the price. The weekly MACD is bearish and stays below the signal line. However, the Histogram is sharply narrowing; the coming week may see this indicator showing a positive crossover.
A large white candle appeared on the charts. This reflects the directional consensus of the market participants on the upside.
The pattern analysis shows a couple of technically important points. First, the NIFTY has moved comfortably above the crucial 15700-16000 levels. This was the support that the index had violated on its way down; it was then acting as a resistance when the NIFTY was trying to move higher. Further, the NIFTY has also moved above the 20-Week MA. Some consolidation and expiry-led moves are likely, but, speaking on broader terms, it is most likely to head towards the 50-Week MA, which is placed at the 17073 level.
The overall environment was stable; this was reflected in the volatility, which came off further as compared to the previous week. INDIAVIX declined by 5.38% to 16.65. The coming week may see some defensives, like Pharma, doing well, along with select financial pockets as well. Apart from these, we are also likely to see laggards like IT trying to play some catch-up as well.
Overall, the coming week is likely to stay highly stock-specific. It is recommended that all moves on the higher side be used more to protect profits at higher levels, rather than continuing with a blind chase of the up-move. There may not be major downsides on the cards, but profit-booking from higher levels may not be ruled out.
Sector Analysis for the Coming Week
In our look at Relative Rotation Graphs®, we compared various sectors against CNX500 (NIFTY 500 Index), which represents over 95% of the free float market cap of all the stocks listed.
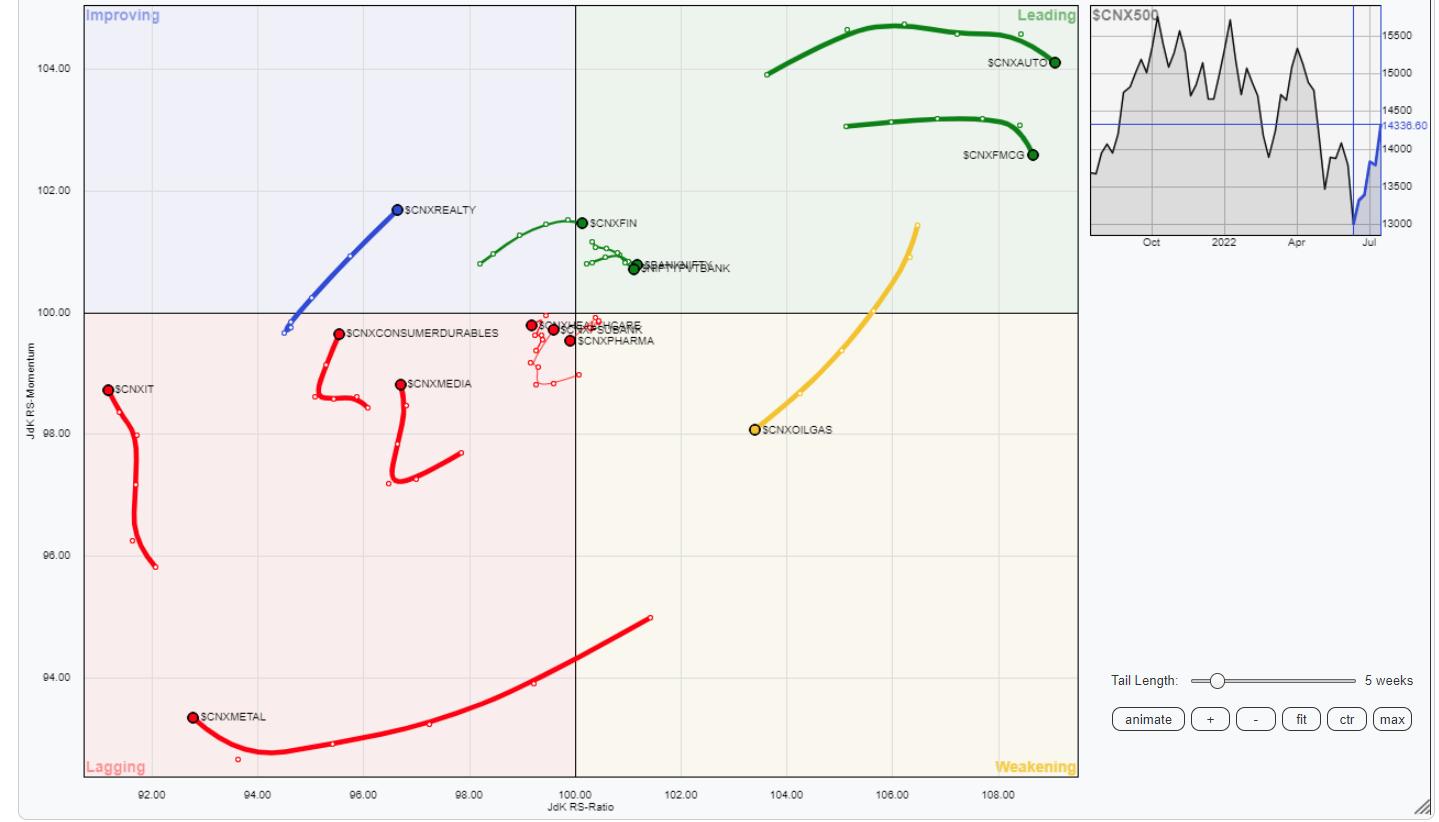
The analysis of Relative Rotation Graphs (RRG) shows NIFTY Financial Services Index has rolled inside the leading quadrant. It joins NIFTY Auto, BankNifty, FMCG, and Consumption indexes, which are also placed inside the leading quadrant. We can expect these groups to continue to relatively outperform the broader markets.
The NIFTY Infrastructure, PSE, and Energy groups are seen heading lower inside the weakening quadrant. The Midcap Index, while being inside the lagging quadrant, is seen trying to roll back towards the leading quadrant.
The NIFTY Commodities and Metal indexes continue to languish inside the lagging quadrant. The Media and the IT indexes are also inside the lagging quadrant, but they are seen trying hard to improve their relative momentum against the broader markets. We may see some stock-specific outperformance from these pockets.
The NIFTY Realty Index is seen rotating firmly while being placed inside the improving quadrant. The NIFTY Services index has also rolled inside the improving quadrant, hinting at a potential end to its phase of underperformance against the broader markets.
Important Note: RRG™ charts show the relative strength and momentum for a group of stocks. In the above Chart, they show relative performance against NIFTY500 Index (Broader Markets) and should not be used directly as buy or sell signals.
Milan Vaishnav, CMT, MSTA
Consulting Technical Analyst
www.EquityResearch.asia | www.ChartWizard.ae


