After taking a breather in the week before this one, the Indian equity markets resumed their up move. The headline index continued with its pullback and moved past a few important levels while protecting the key supports. Over the past five sessions, the markets remained largely in the upward rising trajectory, barring a consolidation for a day in between keeping the general trend bullish. The trading range also widened on the expected lines. The NIFTY oscillated and moved in the range of 613.70, compared against 405.75 points in the week before this one. While shifting its supports higher, the index has opened up some room for itself on the upside. The markets finally ended with net gains of 468.55 points (2.97%) on a weekly basis while forming a higher top and higher bottom on the charts.
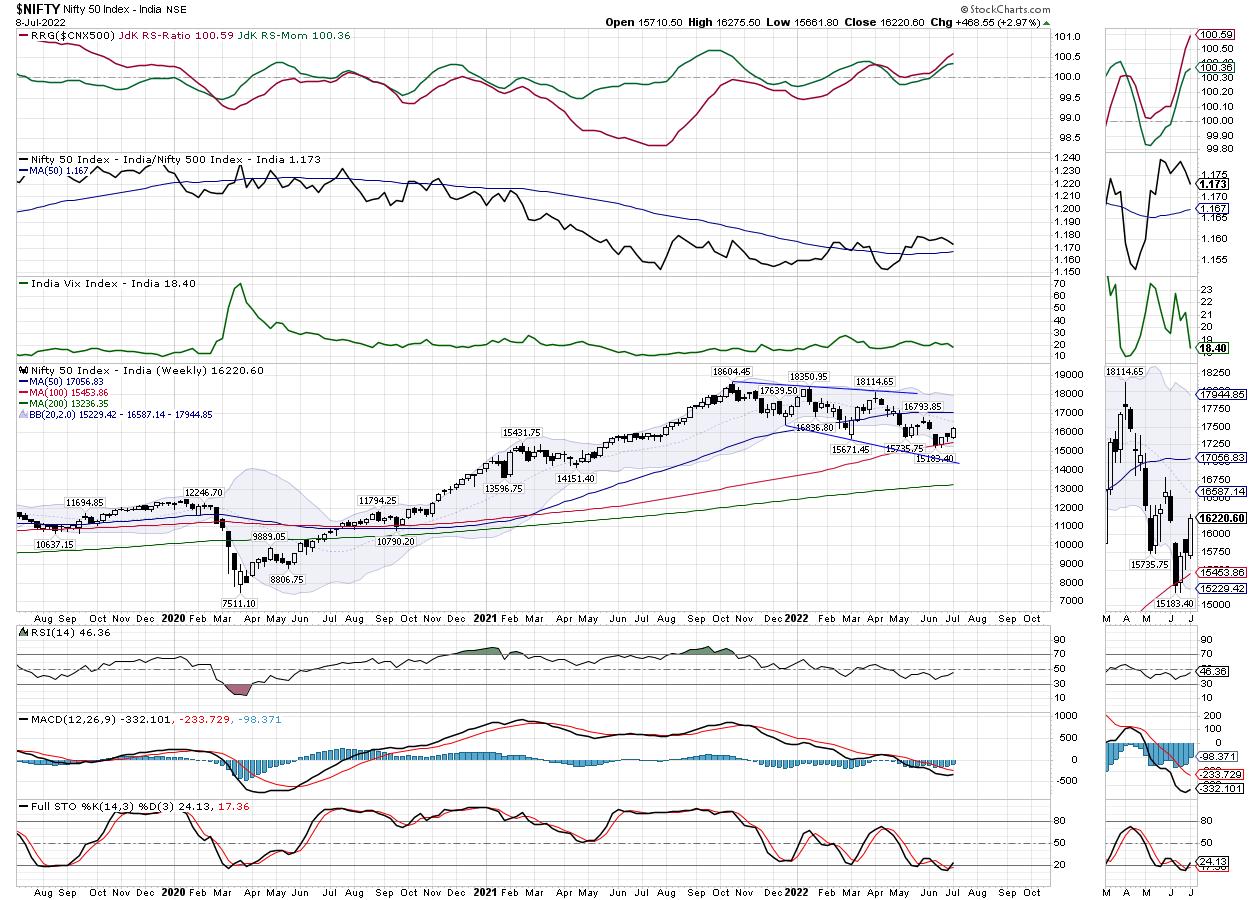
The past five days of trade are important from many technical perspectives. After holding on to the level of the 100-Week MA, the NIFTY has avoided violation of this important support on a closing basis. The 100-Week MA is presently at 15454, making this a crucial support for the NIFTY at close levels. Importantly, the NIFTY has also managed to move past the 15700 levels; the very support that it had violated on its way down. Furthermore, it has also managed to fill up the gap that was created between the 15900-16200 zone. This also translates into the support for the NIFTY moving higher again between the 15950-16000 levels. Volatility also cooled off; INDIAVIX came off by 13.44% to 18.40.
The coming week may well see a stable start; the levels of 16300 and 16480 are likely to act as resistance points. The supports come in at 16160 and 15950 levels. The trading range for the coming week may remain wider than usual.
The weekly RSI is 46.36; it remains neutral and does not show any divergence against the price. The weekly MACD is bearish and trades below the signal line. However, the narrowing gap of the histogram hints at a loss of momentum during the down moves. A strong white body emerged on the candles; this showed a strong directional consensus of the market participants on the upside.
The pattern analysis of the weekly chart shows that the NIFTY has held on to the 100-Week MA levels on a closing basis; apart from this, the index has also crawled above the crucial 15700 levels, which it had violated on its way down. In the process, NIFTY has raised its most immediate support higher at this point.
The weekly options data shows that the 16200 level had seen the highest Put OI getting added on Friday. However, looking at the historical weekly options data, the maximum PUT OI exists at 16200. This means that, in the event of any consolidation, 16000 is likely to act as strong support for the markets. The highest Call OI is presently placed at 16200. This means that, for the coming week, NIFTY's price action against the 16200 levels will be important to watch. If the NIFTY stays above 16200 for long, it may get a bit stronger; however, if it slips below 16200, then we may see the markets consolidate in a defined range for some time.
Sector Analysis for the Coming Week
In our look at Relative Rotation Graphs®, we compared various sectors against CNX500 (NIFTY 500 Index), which represents over 95% of the free float market cap of all the stocks listed.
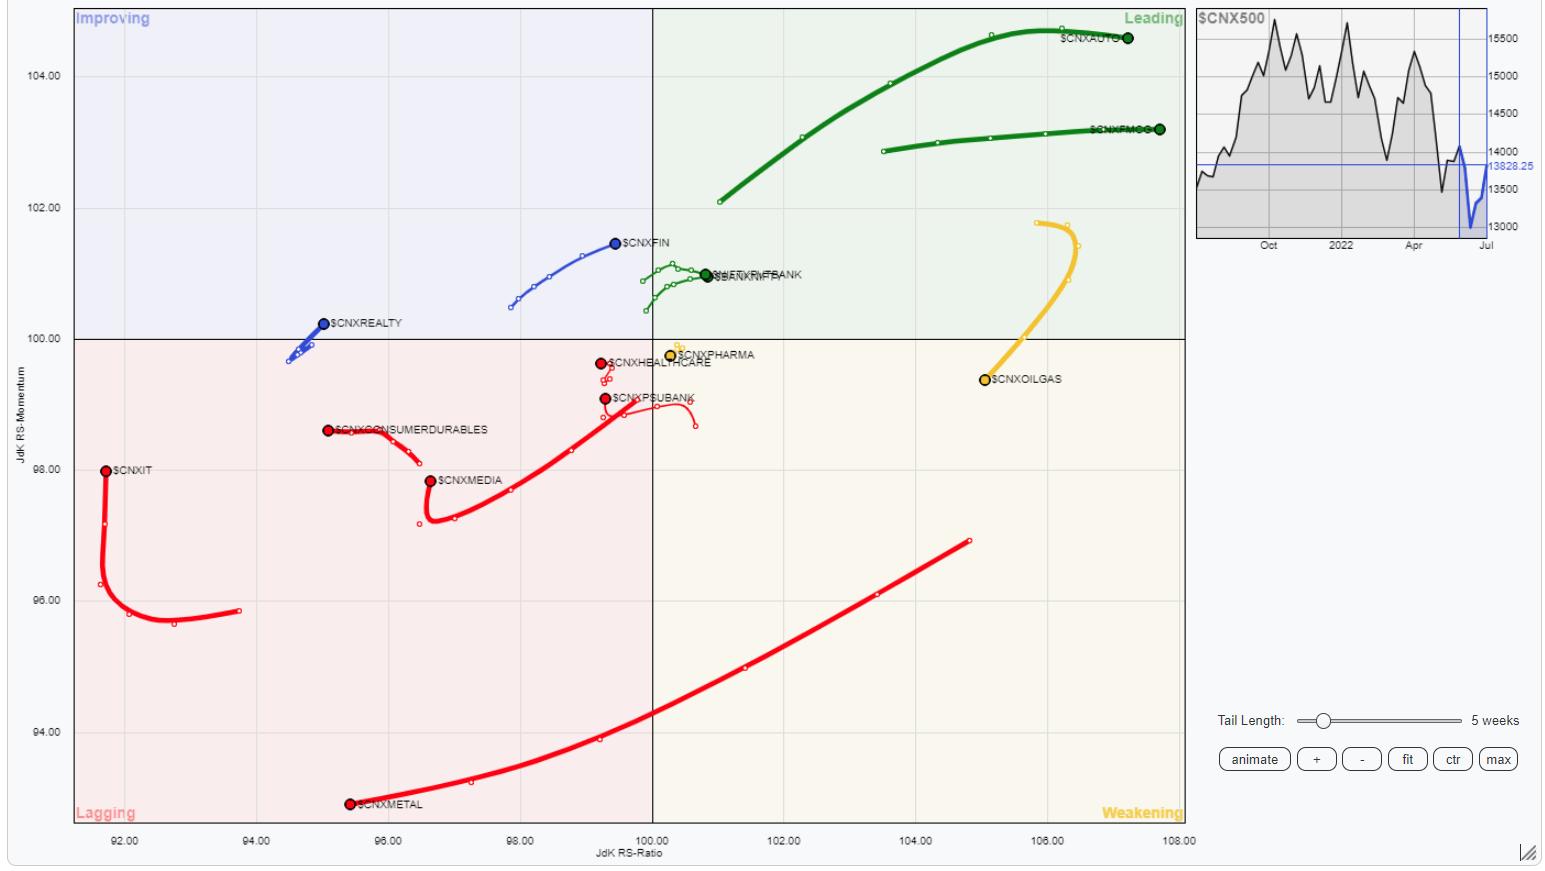
The analysis of Relative Rotation Graphs (RRG) shows that the NIFTY Realty Index and Nifty Services index has rolled inside the improving quadrant. This indicates that both these indices may end their phase of relative underperformance, and may soon begin to improve their relative performance against the broader NIFTY500 index. Apart from this, the NIFTY Financial Services index is also inside the improving quadrant.
We have NIFTY Auto, FMCG, Consumption and NIFTY Bank Index inside the leading quadrant. All these groups are likely to continue to relatively outperform the broader markets.
The NIFTY Infrastructure Index has rolled inside the weakening quadrant. Besides this, the PSE and the Pharma Index are also inside the weakening quadrant.
The Metal Index continues to make its large strides inside the lagging quadrant. The NIFTY Midcap and the Commodities indexes are also seen languishing inside the lagging quadrant. The Media and the IT indexes are also inside the lagging quadrant, but they appear to be improving their relative momentum against the broader markets.
Important Note: RRG™ charts show the relative strength and momentum for a group of stocks. In the above Chart, they show relative performance against NIFTY500 Index (Broader Markets) and should not be used directly as buy or sell signals.
Milan Vaishnav, CMT, MSTA
Consulting Technical Analyst
www.EquityResearch.asia | www.ChartWizard.ae


