In the previous weekly note, it was categorically mentioned that the Indian equities were due to consolidate; any move that leads to a minor correction or consolidation should not surprise anyone. The past five sessions remained much on the expected lines, as the headline index saw some corrective moves, took support at important levels and ended with a minor cut. The trading range also narrowed a bit; the NIFTY moved in a 390.35 points range this week, as compared to 613.70 points in the week prior. While successfully keeping its head above crucial levels, the index closed with a net loss of 171.40 points (-1.06%) on a weekly basis.
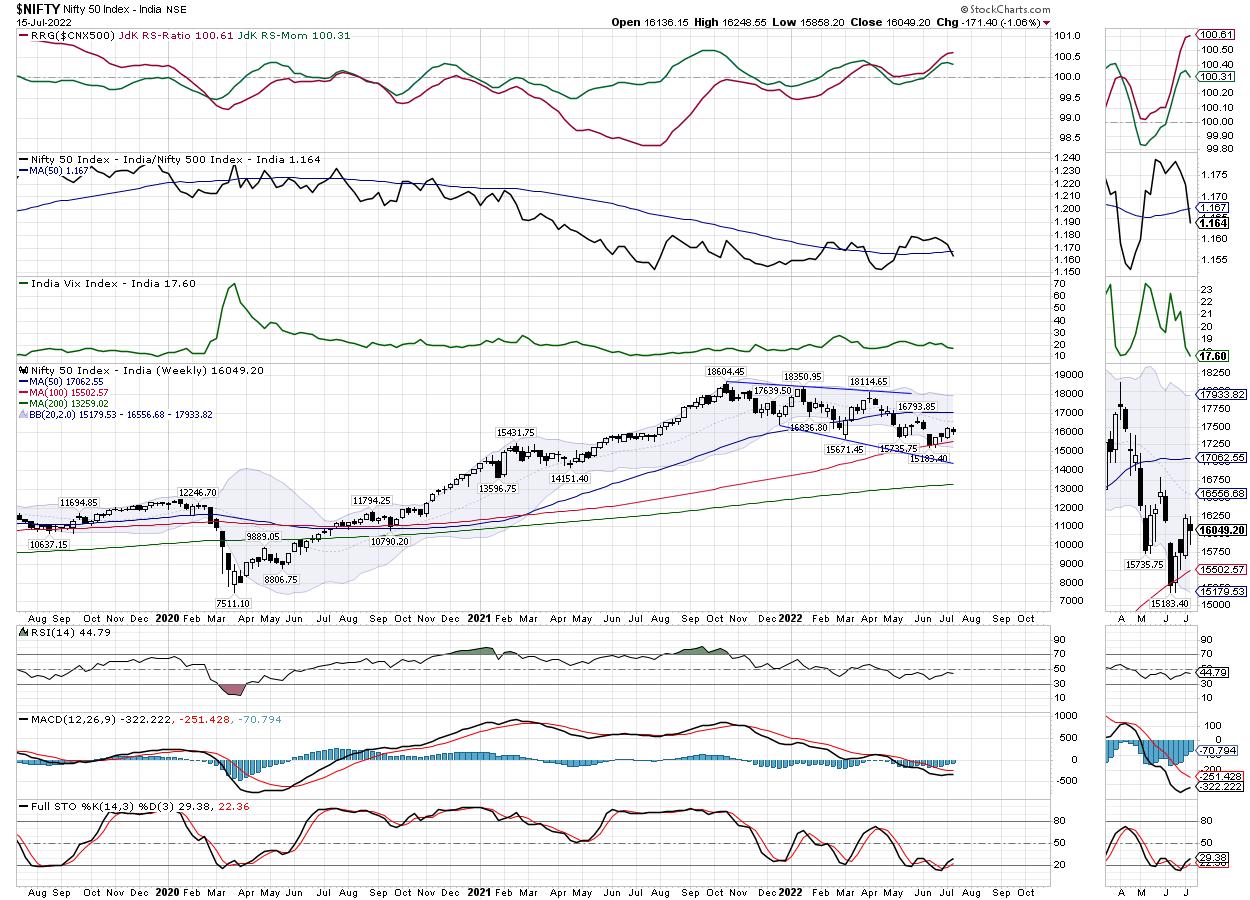
From a technical perspective, the NIFTY defended the 16000 level; this is the upper edge of the 15700-16000 zone, which NIFTY had violated on its way down. During the recent corrective move, the index has managed to defend this zone. Besides this, importantly, the NIFTY has also managed to keep its head above the important 100-WMA levels. NIFTY's managing to stay above 15700-16000 levels was, and will continue to remain, important. Therefore, over the coming weeks, NIFTY's keeping its head above 16000 will be crucial to watch; any slip below this point may lead to some more consolidation/weakness. However, as of now, this seems less likely.
Volatility also declined a bit; INDIAVIX came off by 4.34% to 17.60 on a weekly basis. The coming is likely to start on a buoyant note, with the levels of 16180 and 16495 acting as potential resistance points. The supports will come in at 15900 and 15710 levels, while the trading range is expected to get wider than usual.
The weekly RSI is 44.78; it stays neutral and does not show any divergence against the price. The weekly MACD is bearish and below the signal line. However, the narrowing slope of the Histogram hints at a possible positive crossover over the coming weeks.
A bearish Harami emerged on the candle. A Harami candle is formed when a current candle is completely engulfed by the previous candle. There is also a Spinning Top formation on the candle; this is formed due to a small real body and often denotes periods of consolidation or indecisive behavior of the market participants.
The pattern analysis of the weekly chart shows that the NIFTY has managed to keep its head above 16000 levels; this is the upper edge of the support zone that the NIFTY violated on its way down. The index has managed to crawl back over this and has stayed above, which is a positive sign.
Overall, we will see the markets getting stable; there is a greater chance that, after a bit of consolidation that was witnessed in the previous week, we will see the markets resuming their up move. There is no major change in the sectoral setup from the previous week. Financials will likely try to perform better, and economy-facing stocks like Autos, etc. should do well, along with some defensive sectors. It is recommended that one avoid shorting the markets should they keep their head above the 16000 levels. So long as the markets are above this point, all dips must be used for making quality purchases at lower levels.
Sector Analysis for the Coming Week
In our look at Relative Rotation Graphs®, we compared various sectors against CNX500 (NIFTY 500 Index), which represents over 95% of the free float market cap of all the stocks listed.

The analysis of Relative Rotation Graphs (RRG) shows that there is no major change in the sectoral setup that was seen in the previous week. Defensive groups like NIFTY FMCG, Consumption, and high beta sector like Nifty AUTO remain in the leading quadrant; they are likely to relatively outperform the broader markets. BankNifty is also inside the leading quadrant.
The NIFTY Services sector, Realty and Financial Services sector index are inside the improving quadrant; they are seen maintaining and further improving their relative momentum against the broader NIFTY 500 index.
The NIFTY Pharma is inside the weakening quadrant; it is seen turning around by improving its momentum, and may show stock-specific outperformance going forward from here. Apart from this, the NIFTY PSE, Infrastructure, and NIFTY Energy Index are inside the weakening quadrant.
The NIFTY IT, PSU Bank and NIFTY Media Indexes are inside the lagging quadrant; however, they are seen trying to consolidate their position and may try to post resilient performance if this trend continues. Apart from this, the NIFTY Metals and Commodities indices are seen languishing inside the lagging quadrant.
Important Note: RRG™ charts show the relative strength and momentum for a group of stocks. In the above chart, they show relative performance against NIFTY500 Index (Broader Markets) and should not be used directly as buy or sell signals.
Milan Vaishnav, CMT, MSTA
Consulting Technical Analyst
www.EquityResearch.asia | www.ChartWizard.ae


