The Indian equity markets had a definite directional move over the past five days; it practically nullified the potentially bearish setup that indicated a likely stalling of the present up-move as it trended during the week to end with gains. The markets saw themselves inching higher and opening up some more room for themselves in the process. The trading range remained comparatively modest as NIFTY oscillated 364.90 points during the previous week. The last two sessions were spent in consolidation by the markets; however, the frontline index NIFTY50 still managed to end the day with a net gain of 300.65 points (1.73%).
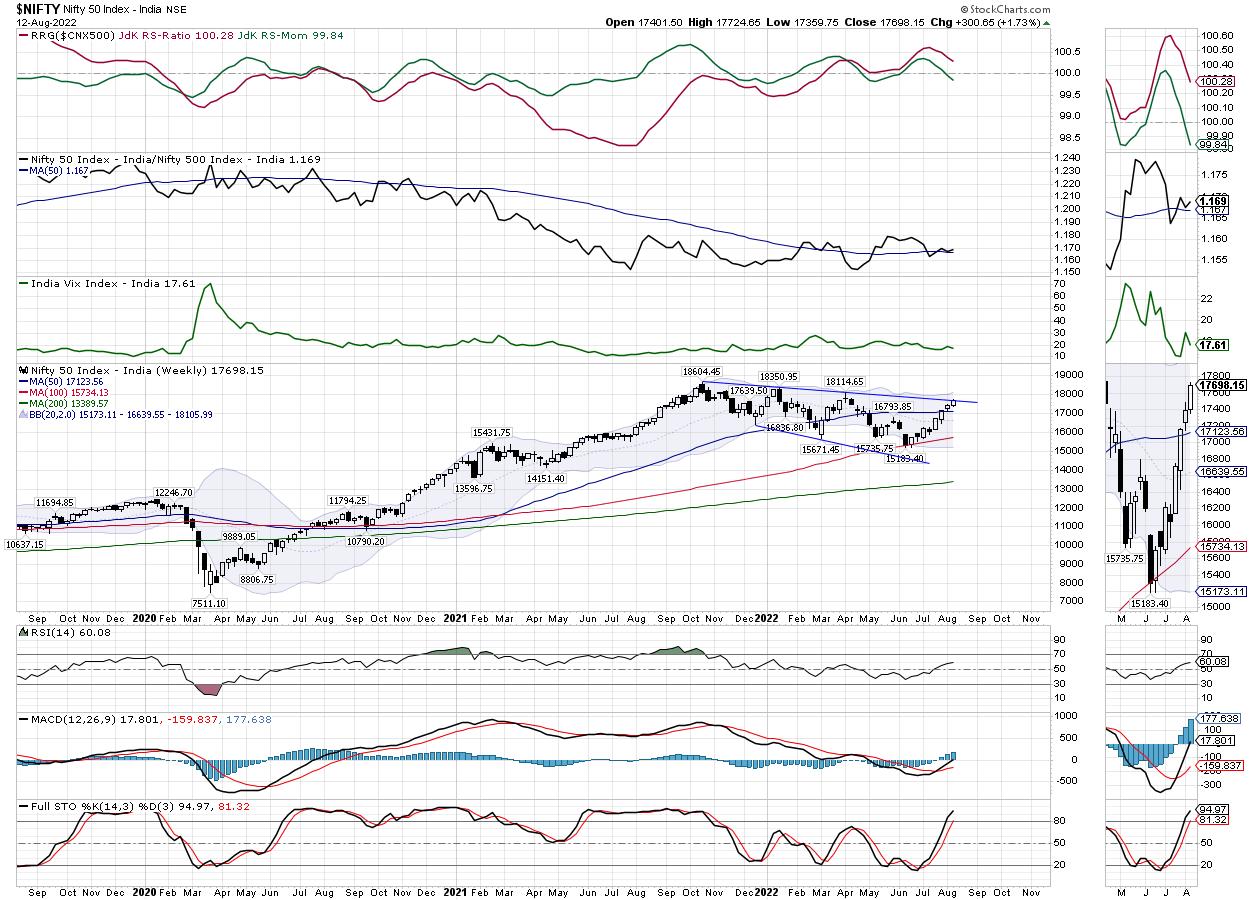
The NIFTY continued moving on the expected lines; as mentioned in our previous technical note, it went on to test the falling trend line pattern resistance that exists in the form of a falling trend line. This trendline begins from the lifetime high point of 18600 and it joins the subsequent lower tops. As evident from the charts, each time the NIFTY has tested this falling trendline, it has seen a significant corrective decline from those resistance levels. Besides this, the options data suggest high Call writing at 17700 and 17800 levels; this would mean that if the markets witness incremental upsides, then it is likely that they would face stiff resistance in this 100-point zone. The upsides may either stay capped; in other words, a meaningful incremental move would occur only above 17800 levels.
The coming week is a short-trading week; we have an extended weekend this time with Monday being a trading holiday on account of Independence Day. The 4-day trading week is likely to see the levels of 17800 and 17935 acting as potential resistance points. The supports are expected to come in at 17550 and 17465 levels.
The weekly RSI is 60.07; it has marked a new 14-period high which is bullish. However, RSI remains neutral and does not show any divergence against the price. The weekly MACD is bullish and remains above the signal line. A white body appeared on the candles; apart from this, no other formations were seen on the charts.
The pattern analysis of the weekly chart for NIFTY shows that the index presently trades above all its key moving averages. After forming a lifetime high at 18600 levels, NIFTY has been in a downward sloping corrective trading zone; in the process, it has formed marginal lower highs. The NIFTY has just halted below the falling trend line pattern resistance; this pattern resistance trend line begins from the high point of 18600 and joins the subsequent lower tops.
This falling trend line pattern resistance is placed in the zone of 17700 and 17800 levels. These are also the two strike prices that show the highest accumulation of CALL OI. This means that NIFTY has strong resistance to face in the 100-point zone of 17700 and 17800 levels. Further thrust and meaningful incremental up-move shall happen only after these levels are taken out convincingly. The coming week is likely to stay stock-specific; it is recommended to guard profits at higher levels as the markets, in general, are prone to some ranged consolidation from current levels.
Sector Analysis for the coming week
In our look at Relative Rotation Graphs®, we compared various sectors against CNX500 (NIFTY 500 Index), which represents over 95% of the free float market cap of all the stocks listed.
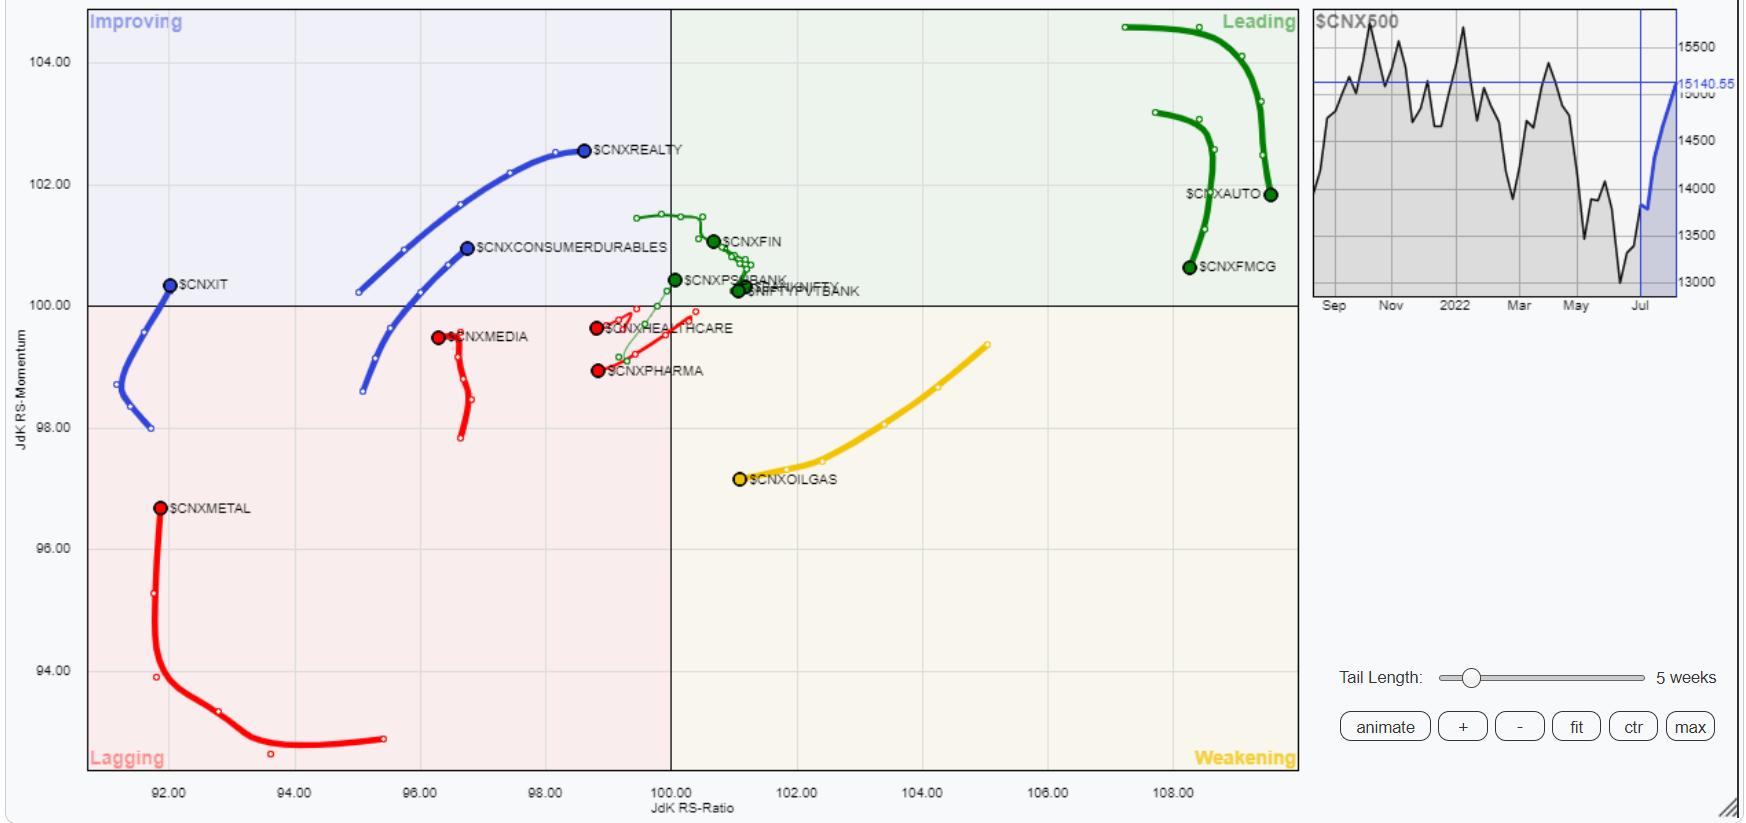
The analysis of Relative Rotation Graphs (RRG) shows that despite being in the leading quadrant, Banknifty, Nifty Consumption, FMCG, Auto, and Financial Services indexes are paring their relative momentum against the broader markets. However, it is also important to note that the NIFTY Midcap100 Index and the PSU Bank index have rolled inside the leading quadrant and may relatively outperform the broader NIFTY500.
NIFTY Energy remains in the weakening quadrant.
NIFTY Infrastructure and NIFTY PSE Indexes have rolled inside the lagging quadrant and may see relative underperformance against the broader markets. Besides this, NIFTY Pharma and Media also continue to languish inside the lagging quadrant. NIFTY Commodities and Metal Index are inside the lagging quadrant but they appear to be improving their relative momentum.
NIFTY IT stays in the improving quadrant along with the Realty Index. These may continue to perform well over the coming week.
Milan Vaishnav, CMT, MSTA
Consulting Technical Analyst
www.EquityResearch.asia | www.ChartWizard.ae


