After taking support near the key levels on the charts, the NIFTY finally resumed its up move, ending the week on a decently positive note. The last three weeks had seen the index taking support at its 20-Week MA; now, the NIFTY is above all the key moving averages. The past five sessions saw the Index trading in a range of 571.60, which was wider than what was seen over the past few weeks. While staying and closing above key supports, the headline index ended with a net gain of 390.60 points (+2.27%) on a weekly basis.
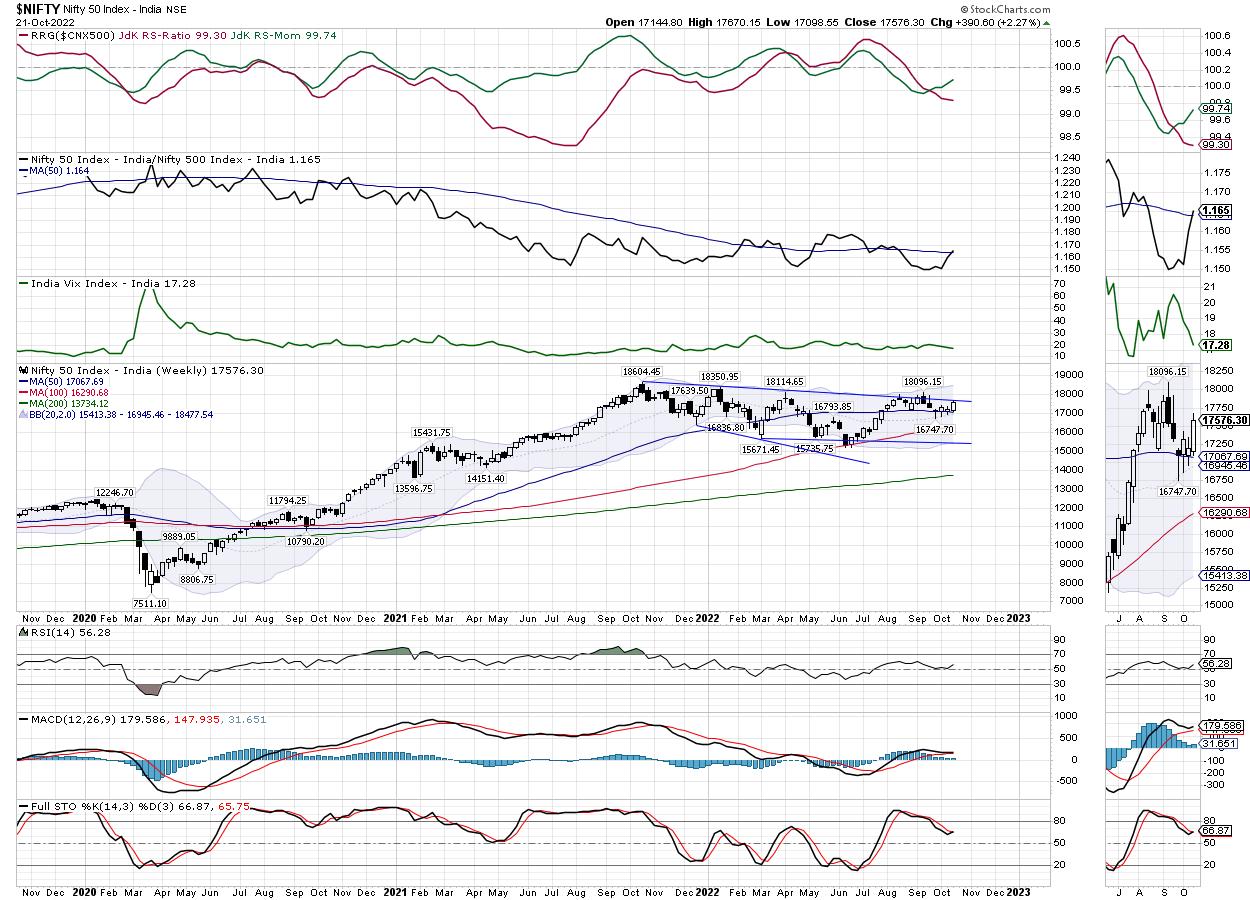
From a technical perspective, NIFTY is now trading above all the key moving averages; however, it has yet to give a clean breakout on the weekly charts. If this happens, we may well be heading towards 18000-levels again. On the other hand, the US Markets, which have been a key source of global weakness, have also managed to defend the key supports. The S&P 500 Index, while continuing to show bullish divergences, has successfully defended the 200-Week MA of 3605 levels. So long as the SPX defends 200-DMA, we are unlikely to see any major drawdowns from the current levels. At the most, we may consolidate at higher levels and trade with a defined trajectory. We have 16950 as a major level to defend on a closing basis to avoid any major weakness.
Markets have a 3-day short trading week; Monday will have just a symbolic Mahurat trading session and Wednesday is a trading holiday again. The coming week is likely to see levels of 17650 and 17930 acting as potential resistance points. The supports come in at 17300 and 17210 levels. The trading range may not get this wide, as indicated by the technical support and resistance levels, but there may be some good amount of volatility to deal with during the week.
The weekly RSI is 56.28; it remains neutral and does not show any divergence against the price. The weekly MACD is bullish and trades above the signal line. A strong white-bodied candle emerged; this reflected the directional bias of the market participants on the upside.
We will have some amount of volatility to deal with in the coming week due to practically two market holidays. Monday, which has a mahurat trading session, is generally a symbolic one; no major decisive moves are usually seen. However, when the market opens on Thursday once again after a holiday on Wednesday, it will find itself adjusting to the global trade setup. The US markets are stable; if this stability is sustained, we will find ourselves comfortably inching higher. Any consolidation in the US markets or a struggle to maintain stability will infuse some volatile moves in the domestic markets as well. On the domestic front, all we need to do is keep our heads above the 16980-17100 zone to avoid any weakness from creeping in.
Sector Analysis for the Coming Week
In our look at Relative Rotation Graphs®, we compared various sectors against CNX500 (NIFTY 500 Index), which represents over 95% of the free float market cap of all the stocks listed.
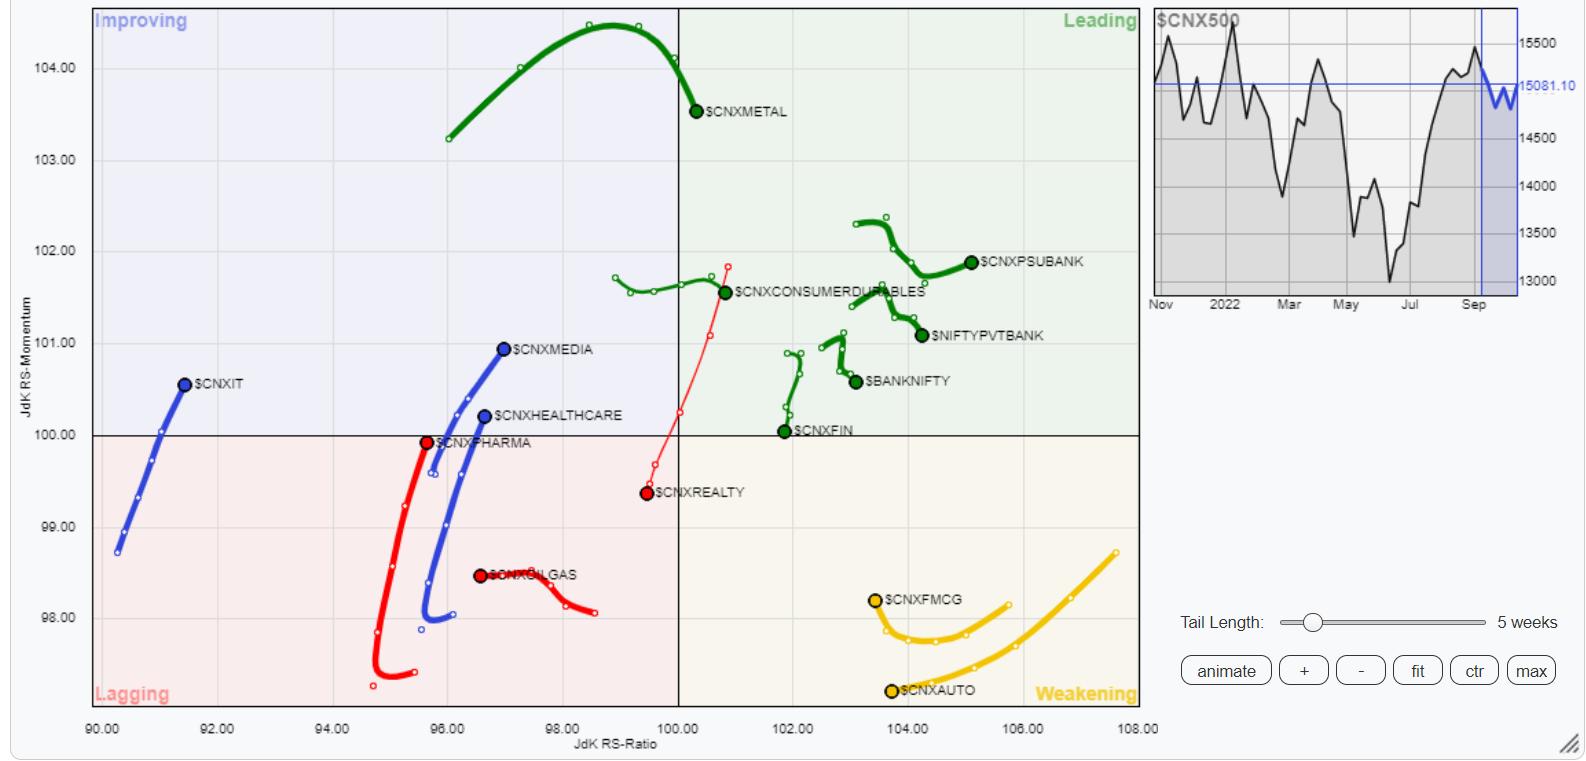
The analysis of Relative Rotation Graphs (RRG) shows that there is no major change in the sectoral setup as compared to the previous week. The NIFTY Midcap and Financial Services Index continue to give up on their relative momentum against the broader markets. Besides this, NIFTY PSU Bank and BankNifty are also placed inside the leading quadrant and are expected to relatively outperform the broader markets despite some minor loss of momentum in the BankNifty.
NIFTY Metals has rolled inside the leading quadrant. Along with the above groups, the Metal Index is also set to relatively outperform the broader markets.
NIFTY Consumption and FMCG indexes are inside the weakening quadrant; however, the FMCG index is seen sharply improving on its relative momentum against the broader NIFTY500 Index. The NIFTY Auto continues to slide further inside the weakening quadrant.
The NIFTY Realty Index continues to languish inside the lagging quadrant and is likely to relatively underperform the broader NIFTY 500 Index along with NIFTY Energy Index, which is also placed inside lagging. The NIFTY Pharma and Infrastructure Index are also inside the lagging quadrant, but are seen improving on their relative momentum.
The NIFTY PSE Index is inside the improving quadrant along with the commodities, IT and the Media Index.
Important Note: RRG™ charts show the relative strength and momentum for a group of stocks. In the above Chart, they show relative performance against NIFTY500 Index (Broader Markets) and should not be used directly as buy or sell signals.
Milan Vaishnav, CMT, MSTA
Consulting Technical Analyst
www.EquityResearch.asia | www.ChartWizard.ae


