After spending nearly 10 weeks below the falling trend line pattern resistance and taking support at important levels, the NIFTY has finally attempted to break above this significant resistance pattern. In the short trading week interrupted by a holiday, the markets continued inching higher while keeping their head above the crucial supports. The volumes through the week remained less due to just three full trading sessions; the trading range through these days also remained narrower than usual. The index saw itself moving in a 201.90-point range over these days. The headline index finally ended with a net gain of 210.50 points (+1.20%) on a weekly basis.
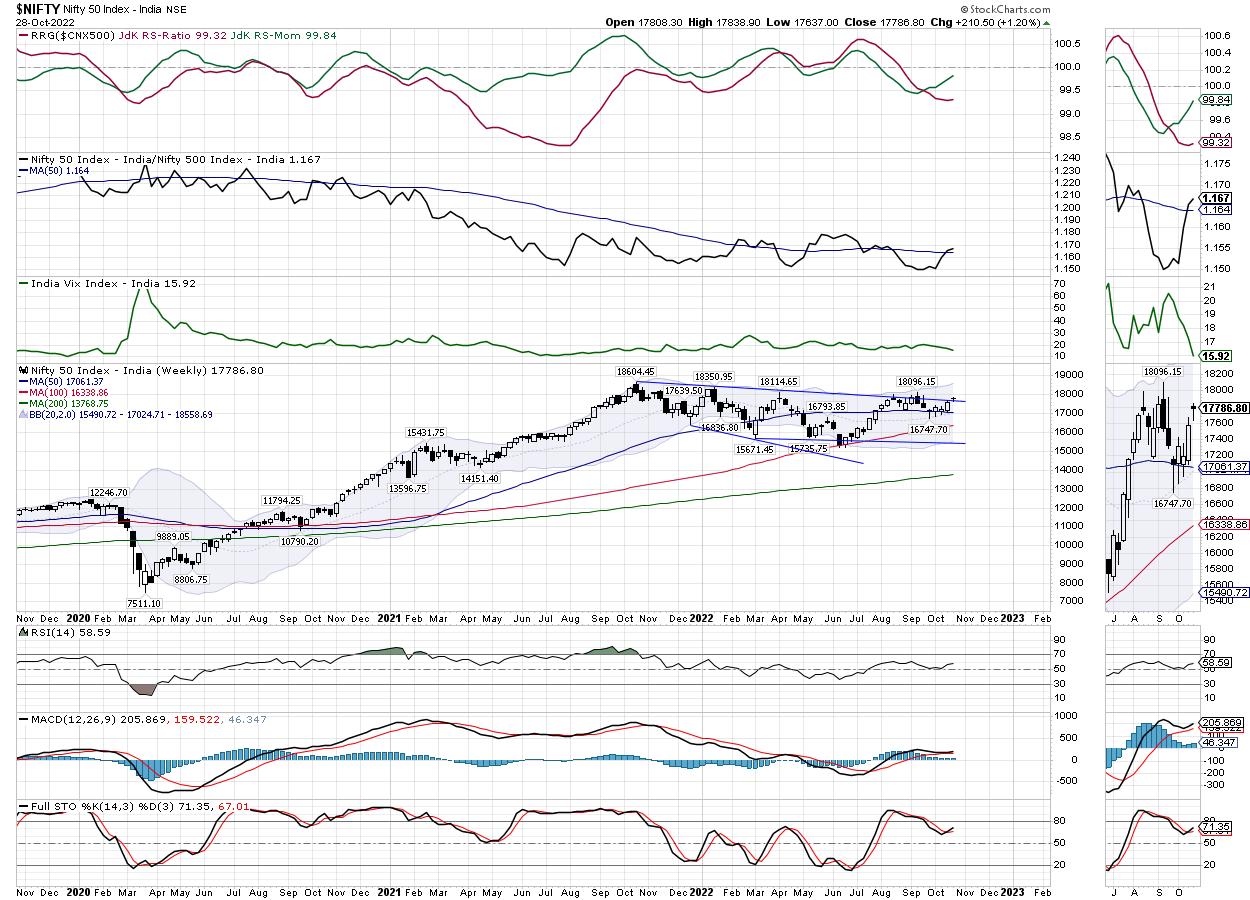
If we revisit the technical structure of the global markets that was discussed many times in the weekly technical notes, heavy reliance was placed on the bullish divergence of the lead indicators that was seen on the global indexes; especially the Dow, Nasdaq, and S&P 500. It was mentioned often in these notes that, if the global markets put a potential bottom for themselves in place, we would see a stronger pullback in the Indian markets, as we are relatively stronger than the US markets. With things turning out on the expected lines, there is a greater possibility of NIFTY extending its up move and moving towards 18000 levels and higher. Volatility decreased; INDIAVIX came off by 7.86% during the week to 15.92.
Given the strong global trade setup, NIFTY is likely to see a stronger start to the trading week. The levels of 18000 and 18385 may act as potential resistance points; the supports are likely to come in at 17600 and 17450 levels. The trading range is once again likely to get wider over the coming days.
The weekly RSI is 58.59; it remains neutral without showing any divergence against the price. The weekly MACD is bullish and stays above the signal line. The histogram that was sharply narrowing is seen getting wider again; this indicates a return of momentum in the up move that the markets have recently witnessed.
The pattern analysis shows yet another attempt by the NIFTY to break above the significantly important pattern resistance of a falling trendline. This trend line begins from the lifetime high levels of 18600 and joins the subsequent lower tops.
All in all, the S&P 500 has not only respected the 200-Week MA and has rebounded while putting its bottom in place, but it has also laid a solid ground for the continuance of up move in domestic markets. Monday is likely to see a strong beginning of the week; it would be crucially important to see the NIFTY moving past 18000 levels and staying above there. It is recommended to focus now on the index stocks; large-caps are also likely to start relatively outperforming the broader universe. A positive outlook is advised for the coming week.
Sector Analysis for the Coming Week
In our look at Relative Rotation Graphs®, we compared various sectors against CNX500 (NIFTY 500 Index), which represents over 95% of the free float market cap of all the stocks listed.
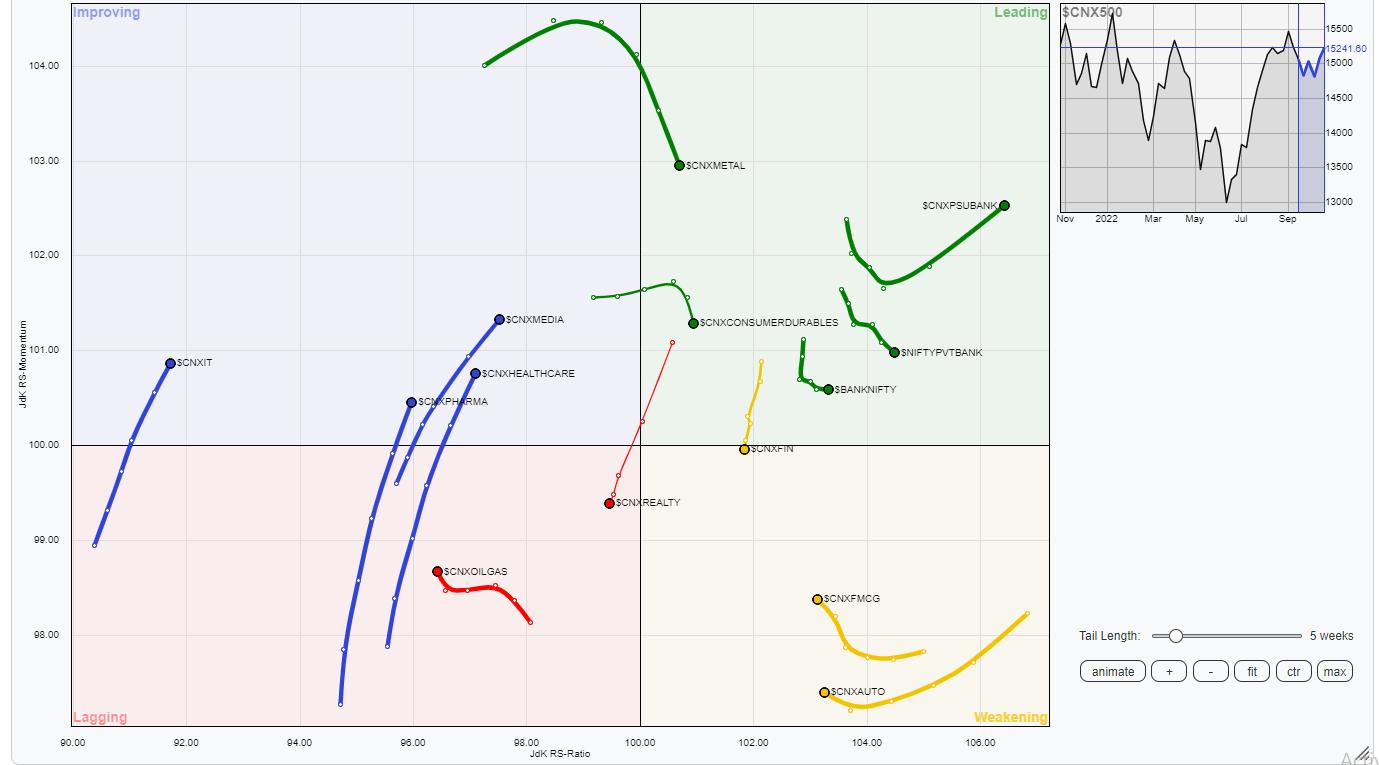
The analysis of Relative Rotation Graphs (RRG) shows that NIFTY Bank, PSU Bank and Metal Indexes are inside the leading quadrant; they are likely to relatively outperform the broader markets. The Nifty MIDCAP Index is also inside the leading quadrant, but is seen sharply losing its relative momentum and heading toward the weakening quadrant.
The Nifty Financial Services Index has rolled inside the weakening quadrant. The Consumption, FMCG, and Auto indexes are also inside the weakening quadrant.
The NIFTY Realty and the Energy indexes are seen languishing inside the lagging quadrant.
The NIFTY Infrastructure Index has rolled inside the improving quadrant. Besides this, the IT, Commodities, Media, Pharma, and the PSE Index are also inside the improving quadrant, along with the NIFTY Services Sector Index, which is seen giving up on its relative momentum against the broader markets.
Important Note: RRG™ charts show the relative strength and momentum for a group of stocks. In the above Chart, they show relative performance against NIFTY500 Index (Broader Markets) and should not be used directly as buy or sell signals.
Milan Vaishnav, CMT, MSTA
Consulting Technical Analyst
www.EquityResearch.asia | www.ChartWizard.ae


