The markets navigated the past week quite on the analyzed lines; what we witnessed was a classical consolidation taking place. The NIFTY did not take any directional move throughout the week. Intermittent profit-taking bouts were seen; however, these phases saw the markets recovering from the lower levels. The NIFTY Bank Index continued to relatively outperform the NIFTY; this phenomenon is likely to continue in the coming week as well. Given the consolidation, the trading range in the markets stayed on the lower side. The Index oscillated in a 232.35 point range during the week; the headline index finally closed with a minor loss of 42.05 points (-0.23%).
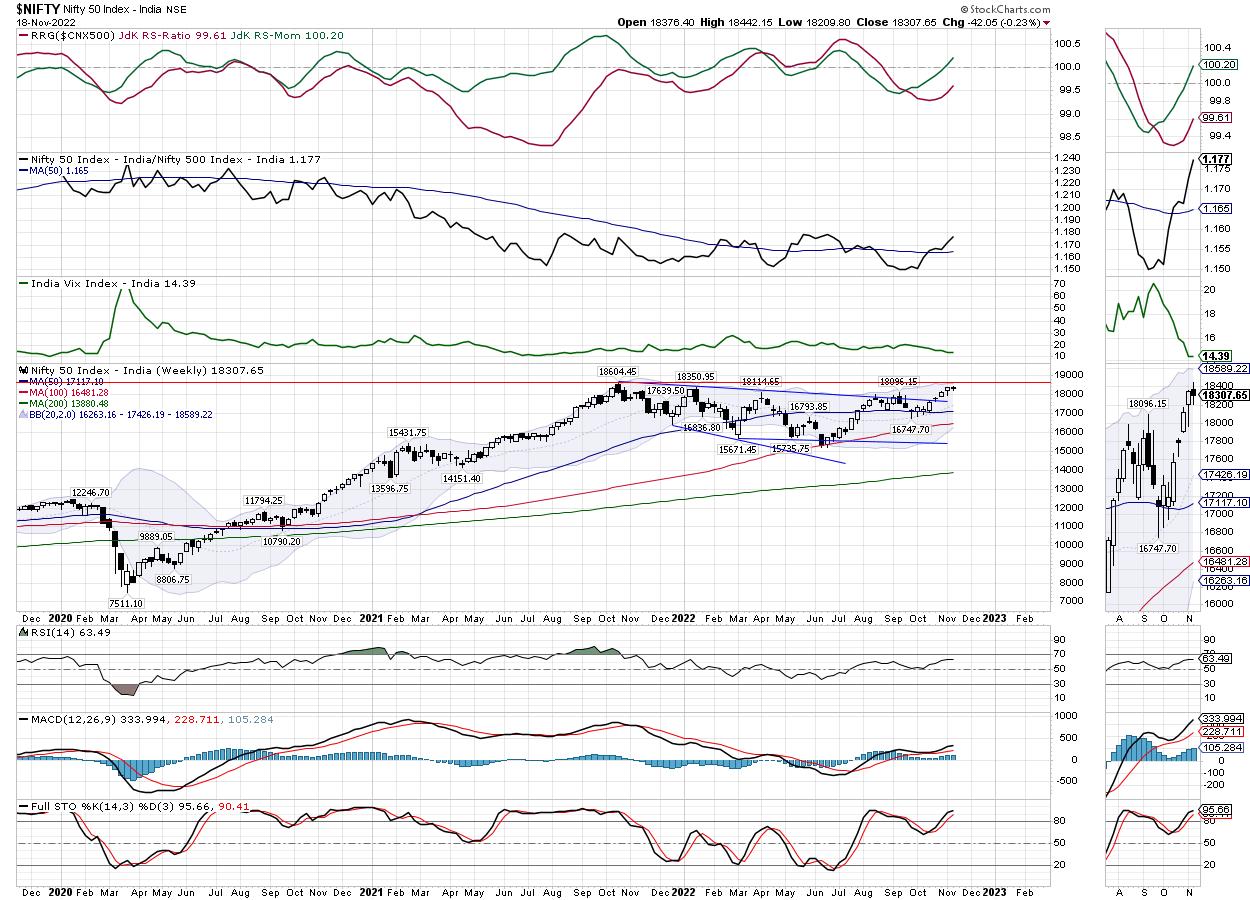
The NIFTY Bank Index remains one of the strongest indexes; while NIFTY remains within a striking distance of its lifetime high, BankNifty has already staged a breakout. So long as this index stays above 41900 levels, this breakout will still be valid and in force. We also enter the expiry week of the current month's derivative series; this will keep the markets influenced by the rollover-centric activities. The derivative data shows that NIFTY has a stiff resistance between the 18300-18400 levels. The markets will remain under consolidation so long as it trades below this zone. Fresh resumption of the up-move shall happen only after NIFTY moves above 18400 levels. Volatility remained unchanged; INDIAVIX declined just 0.10% to 14.39.
The coming week is set to see a stable start to the day. The levels of 18410 and 18600 will act as potential resistance levels; the supports come in at 18200 and 18060 levels. The trading range over the coming days is likely to stay capped if the NIFTY stays below 18400 levels.
The weekly RSI is 63.49; it remains neutral and does not show any divergence against the price. The weekly MACD is bullish and trades above the signal line. A spinning top emerged on the candles; this shows the indecisive behavior of the market participants.
Pattern analysis of the weekly chart shows that the NIFTY is exhibiting fatigue as it approaches the lifetime high point of 18600 levels. There is a minor resistance zone between 18300-18400 levels; unless this zone is taken out with volumes, we will see the markets continuing to consolidate in a defined range.
From a technical perspective, there is a greater possibility that, even if BankNifty consolidates at current levels or extends its move, NIFTY is likely to play catchup given its recent underperformance against the Bank Index. However, for this, it would be necessary for the NIFTY to move past the 18300-18400 levels. In other words, the zone of 18300-18400 levels has now become an inflection point for the NIFTY. Until these levels are comprehensively taken out, we may see the markets staying under consolidation.
The coming few days are also likely to stay stock-specific; unless the NIFTY does not move above 18400, it would be very wise to protect profits at current levels. New purchases must be kept limited to stocks that enjoy strong relative strength. A cautiously positive outlook is advised for the coming week.
Sector Analysis for the Coming Week
In our look at Relative Rotation Graphs®, we compared various sectors against CNX500 (NIFTY 500 Index), which represents over 95% of the free float market cap of all the stocks listed.
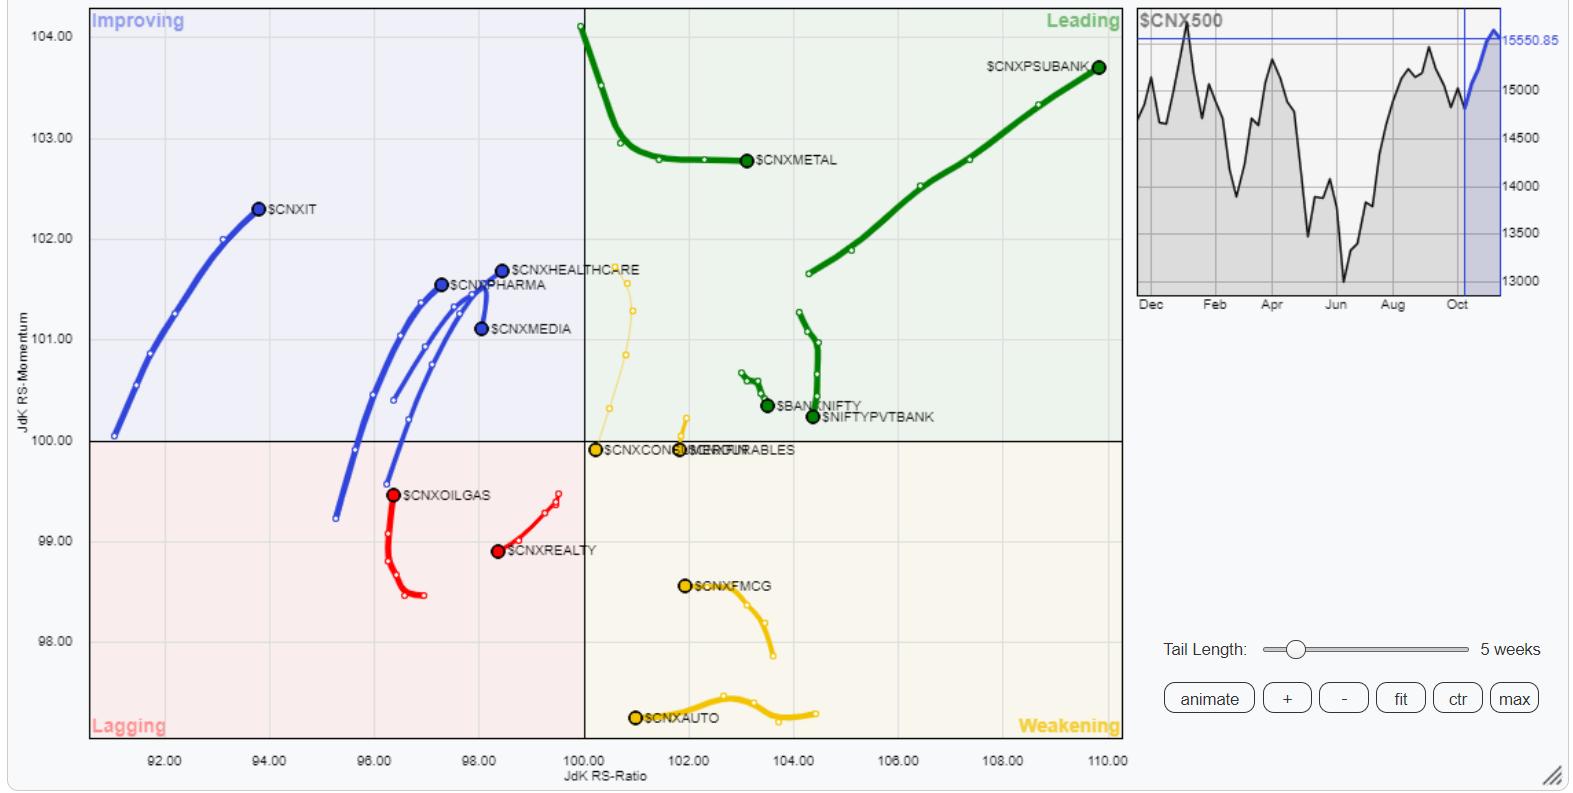
The analysis of Relative Rotation Graphs (RRG) shows NIFTY PSU Bank and Metal Indexes being firmly placed inside the leading quadrant. NIFTY Bank also resides inside the leading quadrant. All these three groups are likely to relatively outperform the broader markets. NIFTY Services Sector Index has also rolled inside the leading quadrant.
The NIFTY Financial Service sector is inside the weakening quadrant; however, looking at the trajectory of the tail, we see it is rotating back towards the leading quadrant. Besides this, the Energy, Auto, Midcap 100, FMCG, and Consumption indexes are also inside the weakening quadrant.
NIFTY Realty and Energy Indexes are seen languishing inside the lagging quadrant.
NIFTY Media Sector Index is seen paring its momentum while being inside the improving quadrant. This will likely lead to relative underperformance of this sector against the broader markets. NIFTY Pharma, PSE, IT, Commodities, and Infrastructure Indexes are seen firmly placed inside the improving quadrant.
Important Note: RRG™ charts show the relative strength and momentum for a group of stocks. In the above Chart, they show relative performance against NIFTY500 Index (Broader Markets) and should not be used directly as buy or sell signals.
Milan Vaishnav, CMT, MSTA
Consulting Technical Analyst
www.EquityResearch.asia | www.ChartWizard.ae


