
After showing a great out-performance until the middle of 2022, this key sector index of the Indian markets is showing signs of slowing down. The technical structure of charts shows that, until a particular level is taken out, a potential top may be in place for this sector index. If we look at this in a different way, this sector will have to move past the 28200 levels to resume its up move and reclaim its leadership. The sector in focus here is NIFTY Energy Index ($CNXENERGY).
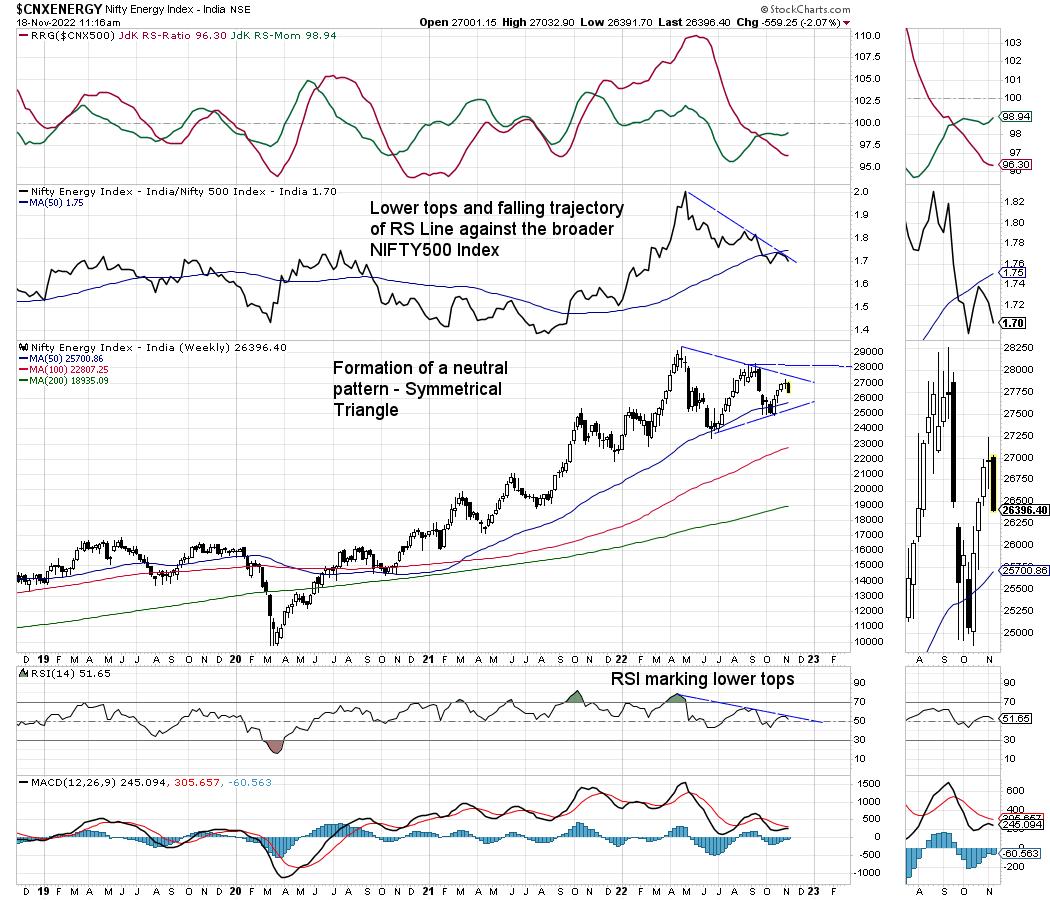
Following strong moves and equally strong relative performance against the broad market NIFTY500 ($CNX500) index until April of this year, the NIFTY Energy Index marked its high point at 29304.05. It showed a corrective retracement after that; it marked subsequent lower tops at 28100 and at 27233.
The recent move shows this sector index is within a neutral pattern of a symmetrical triangle. From a technical perspective, it is important to know that this is a neutral pattern. Any directional move, unless accompanied by confirmation of the price action, must not be anticipated. This pattern can act as a reversal and continuation pattern.
The Index is presently in the lagging quadrant of the RRG; it is likely to relatively underperform the broader markets. The relative strength index (RSI) line against the NIFTY 500 index is in a downtrend when subjected to regular pattern analysis. It has also slipped below the 50-week moving average (MA). RSI, though it remains neutral against the price, is seen making lower tops.
Given this technical structure, it would be best to protect profits in this sector and take some money off the table. It would also be prudent to wait for this technical pattern to resolve on either side before re-entering this group of stocks.
Investors would always get a chance to re-enter energy stocks if the NIFTY Energy Index is able to move above the 28200 level. If it does not do that and slips below the 50-week MA at 27507 and below on a closing basis, it would mean breaking down from this symmetrical triangle pattern.
The present consolidation in this pattern is giving investors enough time to rejig their portfolios; it gives them the opportunity to move into those sectors that have their relative strength intact and sectors that are outperforming the general markets. In the event of any resumption of the up move, an option to re-enter this pocket always remains upon the Nifty Energy Index moving past 28200 levels.


