It was an immensely volatile and eventful week for the markets as they headed towards the last weekly close before the Union Budget. The last three sessions, more particularly the last two sessions, remained marred by the severely bearish reactions to Hindenburg Research's report on the Adani Group stocks. Hindenburg Research is a "forensic financial research" that specializes in spotting companies around the globe that are engaged in wrongdoings and frauds, and they have accused Agani Group of brazen stock manipulation and running an accounting fraud scheme for decades.
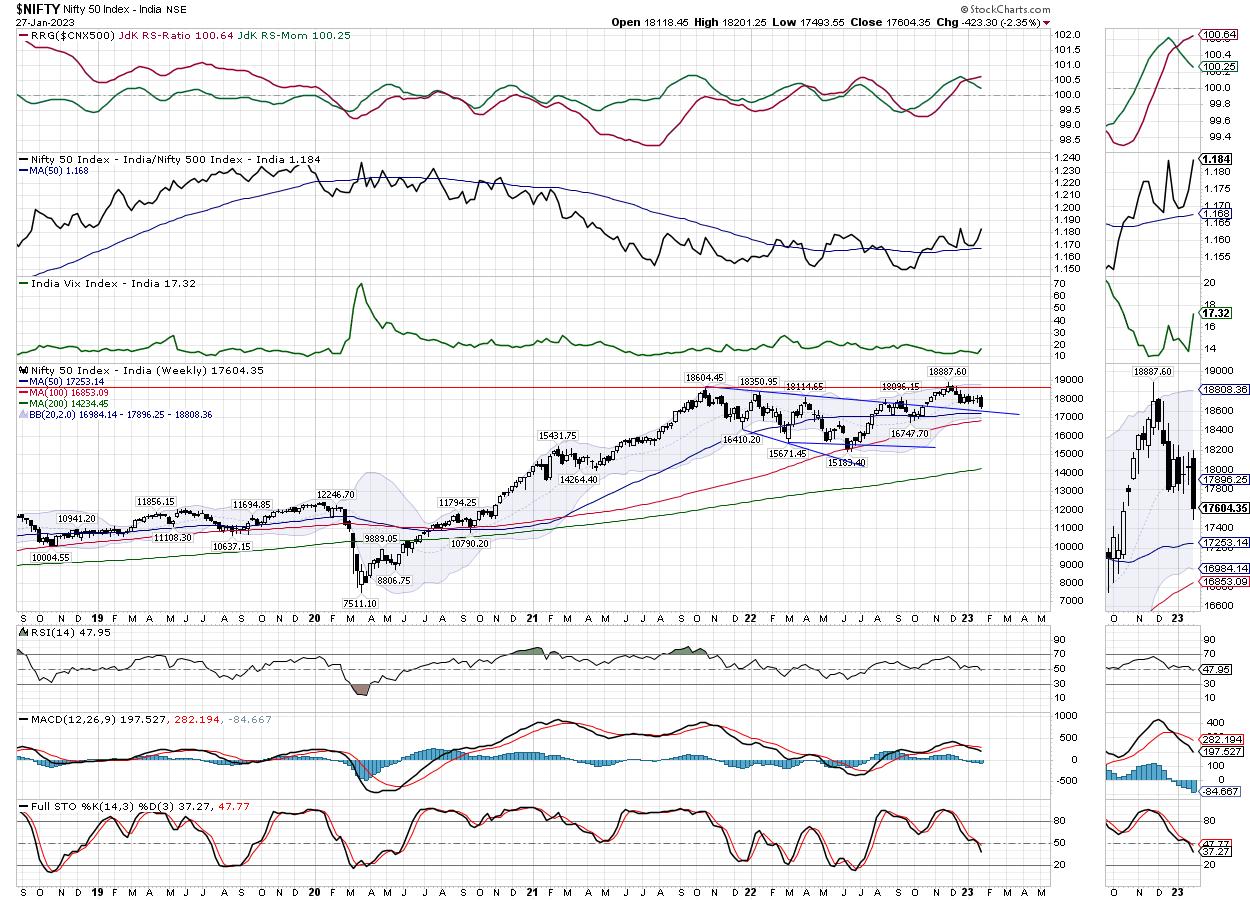
The NIFTY, which took support on the 20-Week MA for five weeks in a row, suffered a strong bearish move on the downside; it violated crucial support levels and dragged resistance levels lower. The index saw a wide trading range of 707.70 points over the previous week. It eventually ended with a net loss of 423.30 points (-2.35%); from the intra-week high point, the NIFTY came off by 600-odd points. Volatility spiked; INDIAVIX rose sharply by 25.65% to 17.32.
The damage that the past sessions have inflicted on the markets has been significant from a technical perspective, moreso as we head into the Union Budget this coming week. The NIFTY has violated the 20-Week MA on the weekly charts, whioch stands at 17896, and also the 100-DMA, which is currently placed at 17950. In the process, the index has dragged its resistance points lower. The coming week has strong resistance at the 17750 and 17860 levels. Supports come in at the 17400 and 17250 levels.
The weekly RSI is at 47.95; it has marked a new 14-period low, which is bearish. It remains natural and does not show any divergence against the price. The weekly MACD is bearish and trades below the signal line. A large engulfing candle has emerged; its emergence while violating important support makes it even more potent in nature.
The pattern analysis shows that the NIFTY has ended up violating two important support levels on different timeframes of charts. It has breached the 20-Week MA, which is at 17896, and has also ended up violating the 100-DMA ,which stands at 17950. This price action has dragged the resistance points for NIFTY quite lower. It also means that all technical pullbacks will find strong resistance at this point, and may meet with selling pressure unless the zone of 17900-17950 is taken out convincingly.
We head into Union Budget this week; it is scheduled to be tabled on Thursday, February 02. This is set to infuse a lot of volatility over the coming days. On one side, the markets are yet to finish their reaction to Hindenburg Report, where the allegations leveled are absolutely serious in nature; on the other hand, it is also set to react to Budget proposals that will be presented.
While the markets face the double-edged sword of volatility, the best way to navigate such an uncertain environment is to keep leveraged exposures at modest levels. Besides this, it would be best to stay invested in sectors like PSE, IT, FMCG, Pharma, etc., which are showing good improvement in the relative strength against the broader markets, or stay invested in low beta sectors that will stay less volatile than the markets in general. From a technical standpoint, NIFTY will not show any meaningful and sustainable up move so long as it stays below 17950. Overall, a highly cautious approach is advised for the coming week.
Sector Analysis for the Coming Week
In our look at Relative Rotation Graphs®, we compared various sectors against CNX500 (NIFTY 500 Index), which represents over 95% of the free float market cap of all the stocks listed.
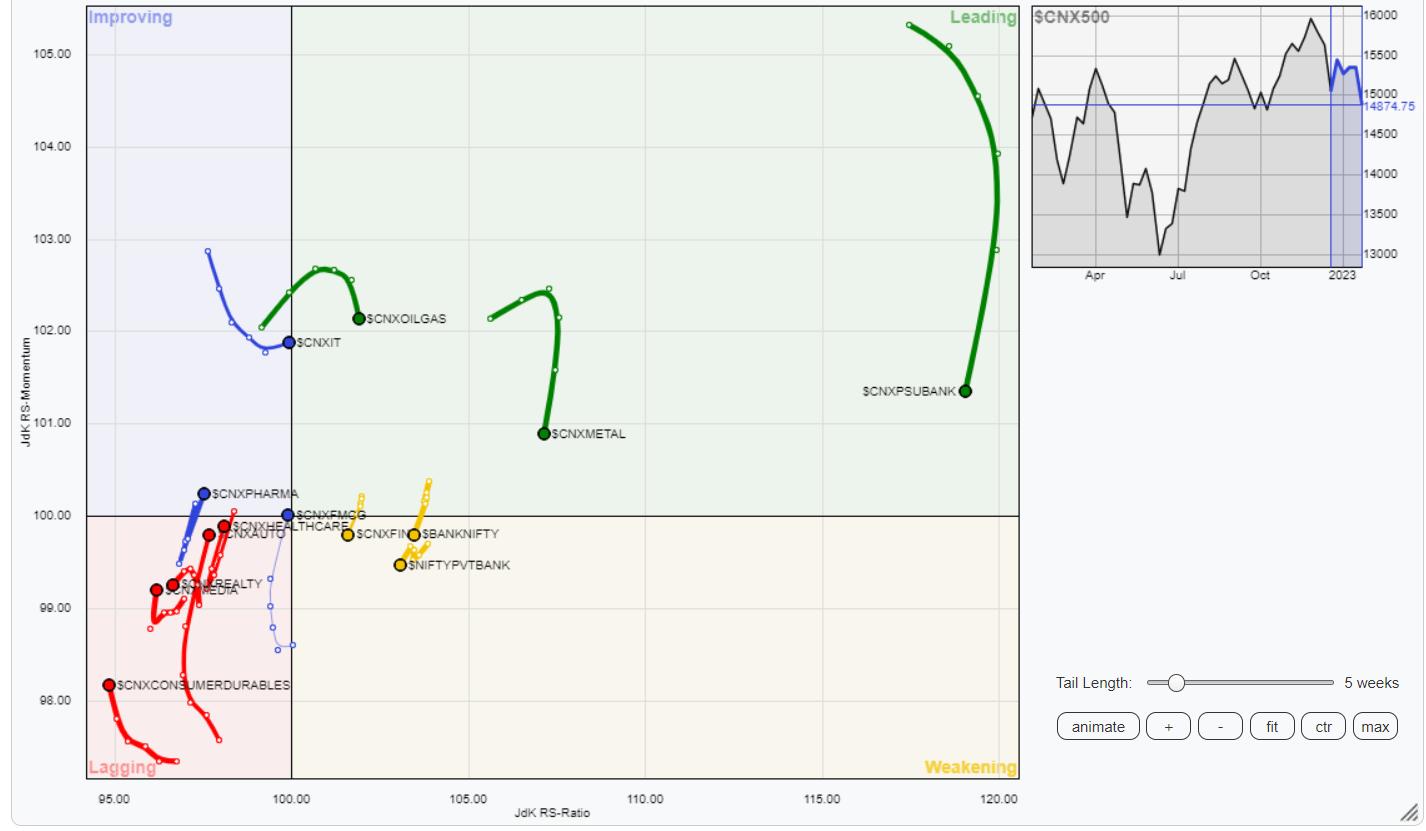
The analysis of Relative Rotation Graphs (RRG) shows some visible changes in the overall sectoral setup as compared to the previous week. NIFTY PSE, Metal, Infrastructure, PSU Bank, and commodities are placed inside the leading quadrant. Out of this, PSE is the only sector that is seen firmly rotating inside this quadrant. The others are showing paring of relative momentum against the broader markets.
BankNifty, Nifty Services Sector, and Financial Services Sector index have rolled inside the weakening quadrant. They may continue to perform individually, but may not perform well on relative terms.
The NIFTY Realty and Media Sector indexes are seen languishing inside the lagging quadrant. However, apart from this, Auto, Consumption, Midcap 100, and FMCG indices are inside the lagging quadrant, but they are seen sharply improving on their relative momentum.
The Pharma index has rolled inside the improving quadrant and is firmly placed along with the IT Index. The Energy Sector index is also inside the improving quadrant, but can be seen slightly giving up on its relative momentum.
Important Note: RRG™ charts show the relative strength and momentum for a group of stocks. In the above Chart, they show relative performance against NIFTY500 Index (Broader Markets) and should not be used directly as buy or sell signals.
Milan Vaishnav, CMT, MSTA
Consulting Technical Analyst
www.EquityResearch.asia | www.ChartWizard.ae


