Over the past couple of weeks, it has been categorically mentioned that, so long as the NIFTY stays below the 18300 levels, it is likely to continue to consolidate in the present range. The index has created a very well-defined trading range for itself at the moment, and has continued to stay within the defined boundaries. The market witnessed mixed trends throughout the previous week, staying quite ranged, with the trading range remaining narrow as the NIFTY oscillated in a 330-point range over the past five sessions. While not showing any directional bias, the headline index closed with a modest gain of 71.05 points (+0.40%) on a weekly basis.
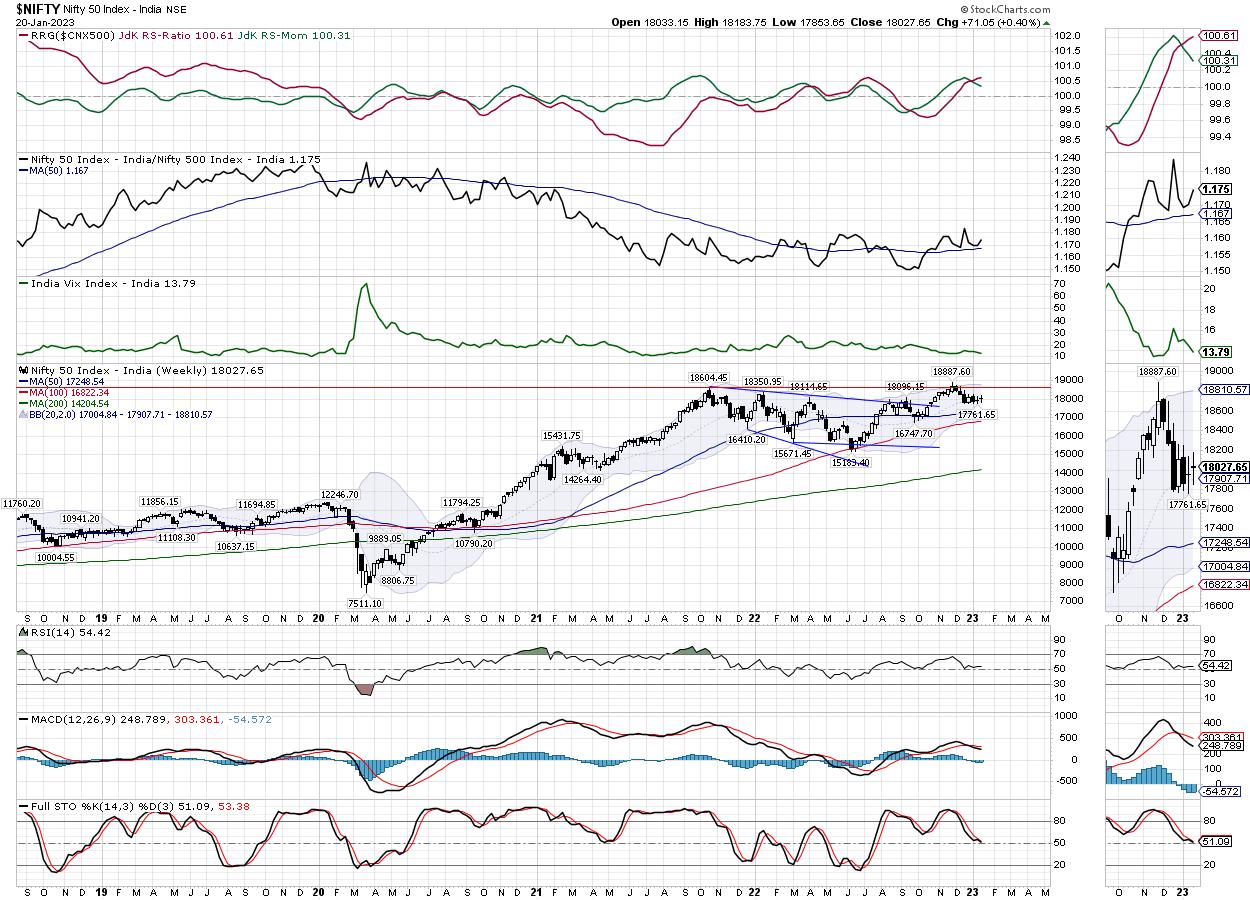
We have a truncated week lined up; January 26th is a trading holiday on account of the observance of Republic Day. There is no major change in the overall technical setup that was seen at the beginning of the previous week. It is important to note that it is now the fifth week in a row that the NIFTY has taken support on the 20-Week MA, which currently stands at 17907. This level also lies in close proximity to the 100-Day MA, which is at 17937. This makes the zone of 17900-17940 a strong support area for the NIFTY, but a slip below this point will invite incremental weakness in the markets.
Volatility dropped; INDIAVIX came off by 4.65% to 13.75 on a weekly basis. The coming week will see the Index facing resistance at the 18300 and 18480 levels. The supports come in at 17900 and 17760.
The weekly RSI is 54.42; it remains neutral and does not show any divergence against the price. The weekly MACD is still bearish, trading below its signal line. A spinning top, close to being called a Doji, appeared on the candles. The emergence of such a candle near the support area lends credibility to the support.
The pattern analysis of the weekly chart shows that NIFTY is taking support at the 20-Week MA, placed at 17907 for five weeks in a row. This point is now a crucial support for the index, coupled with the 100-DMA on the shorter timeframe chart. Overall, the NIFTY is unlikely to take any directional bias so long as it is in this trading range; a sustainable directional bias would emerge only if the NIFTY moves past the 18300 level or slips below the 17900 level.
The overall technical setup remains nearly unchanged this week as compared to the week before. All the markets have done is to just consolidate within a given range and head nowhere. As the markets head towards the Union Budget, which is one of the most important external domestic events, it is likely to consolidate with a positive bias. We will see sectors like PSE, IT, etc. doing well. The Dollar Index is still weak, if it stays this way then it is likely to auger well with the commodities and metal stocks as well. The action in the coming week is likely to stay stock-specific; it is strongly recommended that the overall exposures should be kept at modest levels until a distinct directional bias is established. While staying light on positions, a cautiously positive outlook is advised for the coming week.
Sector Analysis for the Coming Week
In our look at Relative Rotation Graphs®, we compared various sectors against CNX500 (NIFTY 500 Index), which represents over 95% of the free float market cap of all the stocks listed.
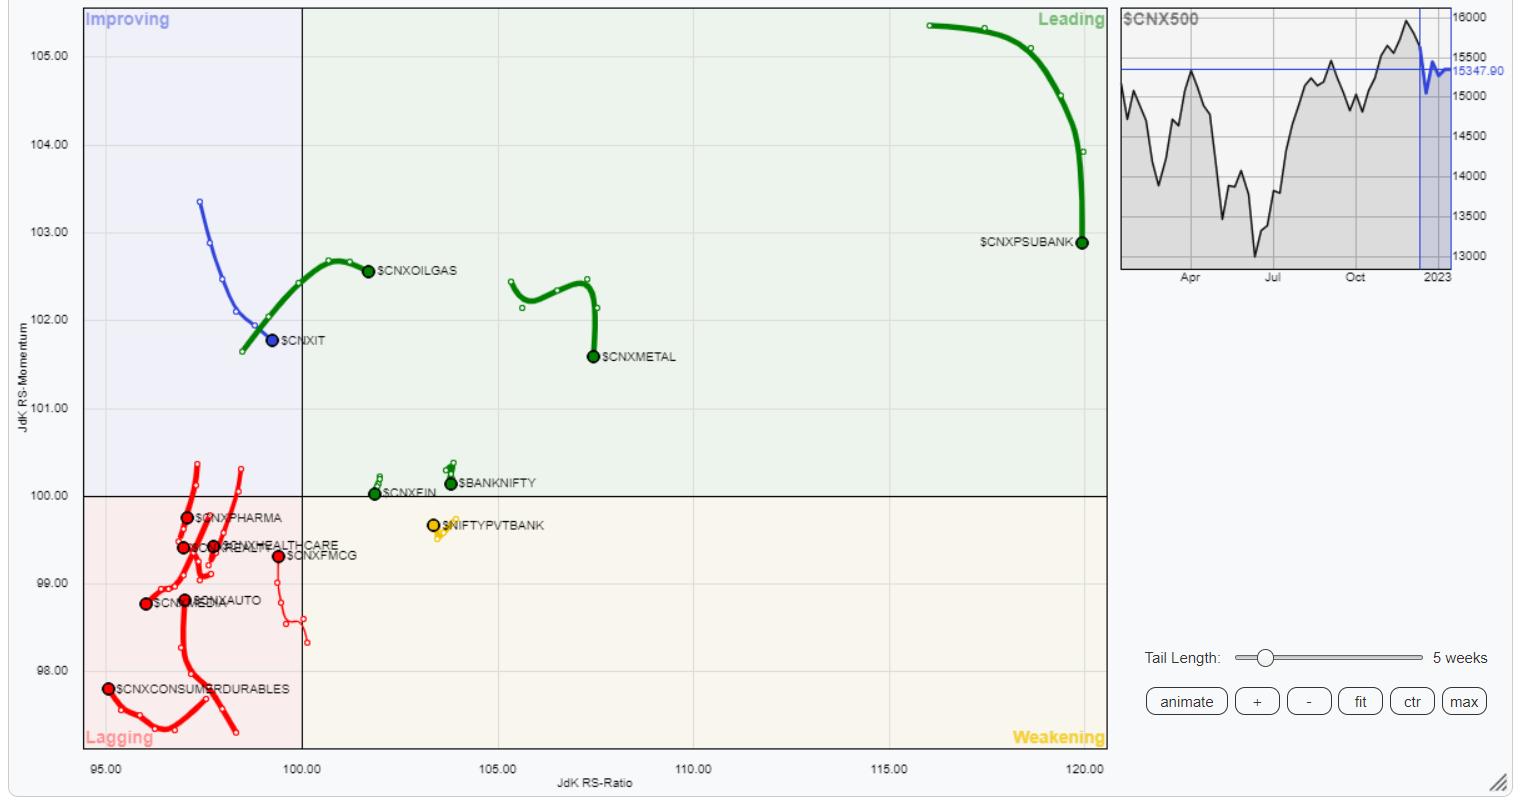
The analysis of Relative Rotation Graphs (RRG) does not show any major changes in the sectoral setup as compared to the previous week. Despite being placed in the leading quadrant, the Metals, PSU Banks, Financial Services, and Services Sector indexes are seen taking a bit of a breather. However, they will continue to relatively outperform the broader market NIFTY500 index, along with Nifty PSE, Infrastructure, Commodities, and BankNifty, which are also placed inside the leading quadrant.
No sector is currently placed inside the weakening quadrant.
The Nifty Realty and Media sector indexes are seen languishing inside the lagging quadrant. They may relatively underperform the broader markets. Besides these sectors, the Auto, Pharma, Midcap 100, FMCG, and consumption sectors are also placed inside the lagging quadrant. However, they appear to be improving on their relative momentum against the broader markets.
The Energy and the IT sectors are placed inside the improving quadrant. They may continue to show resilient performance against the broader markets.
Important Note: RRG™ charts show the relative strength and momentum for a group of stocks. In the above chart, they show relative performance against NIFTY500 Index (Broader Markets) and should not be used directly as buy or sell signals.
Milan Vaishnav, CMT, MSTA
Consulting Technical Analyst
www.EquityResearch.asia | www.ChartWizard.ae


