It was a volatile, but largely quiet, week for the markets. Over the past five sessions, the markets were able to defend their opening lows and were trading flat until the last trading day of the week. The negative closing of the last trading day saw the markets ending in the negative on a weekly note. The trading range was narrower; the NIFTY moved 378.90 points through the week. The index did end up slightly violating important support; however, it tested another important pattern support as well. The headline index NIFTY50 ended with a net loss of 155 points (-0.91%) on a weekly basis.
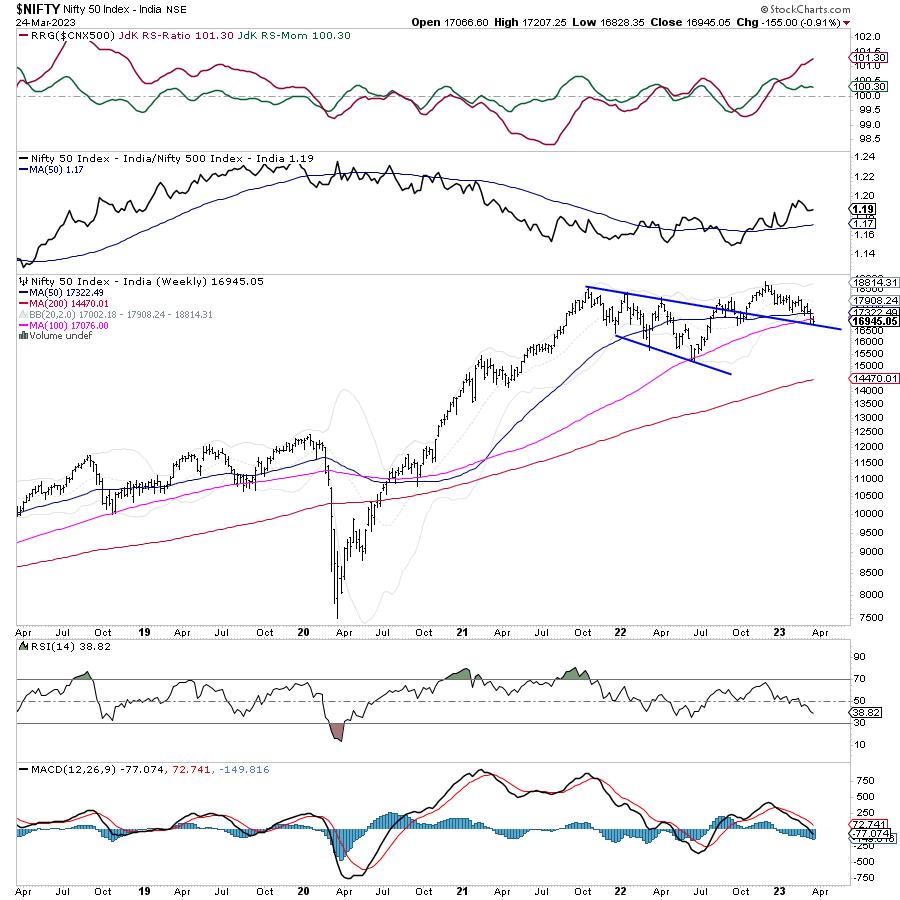
From a technical perspective, the index now is resting at a crucial level. In the previous week, it had closed below the 50-Week MA. This week, the index slipped below the 100-Week MA, which currently rests at 17076. However, it still has not violated the falling channel that it has formed. Presently, the index can be seen testing the lower edge of this falling channel. The coming week is a truncated one; Thursday is a trading holiday on account of Ram Navmi. Because of this, we will have monthly derivatives expiry a day earlier than usual. All in all, NIFTY still has an important support zone of 16850-17000 to defend; it will have to stay above this zone to avoid any weakness further creeping in.
Monday is likely to see a shaky start to the week; the levels of 17100 and 17280 acting as likely resistance points for the markets. Supports will come in at the 16850 and 16720 levels.
The weekly RSI is 38.82; it has marked a new 14-period low, which is bearish. However, it remains neutral and does not show any divergence against the price. The MACD is bearish and remains below the signal line.
The pattern analysis shows that the NIFTY marked its most recent high at 18887; since then, though it remains in corrective decline, it has formed a falling channel. Currently, the index has slipped below the 50- and 100-Week MA, but rests at the lower edge of the falling channel. In the process, the index has also dragged its resistance lower to 17300 from 17500 levels.
Overall, the market is still resting at a crucial juncture. While some supports have been violated on the charts, the zone of 16850-17000 remains defended. As mentioned earlier, NIFTY will have to keep its head above this zone to avoid getting weaker. While a shaky start to the week is expected, there is a possibility that the markets attempt a technical rebound while staying within the broad range. The defensive packs are likely to relatively outperform the broader markets. It is strongly recommended that you maintain leveraged exposures at modest levels so long as the NIFTY is below 17300 levels. A cautious approach is advised for the coming week.
Sector Analysis for the Coming Week
In our look at Relative Rotation Graphs®, we compared various sectors against CNX500 (NIFTY 500 Index), which represents over 95% of the free float market cap of all the stocks listed.
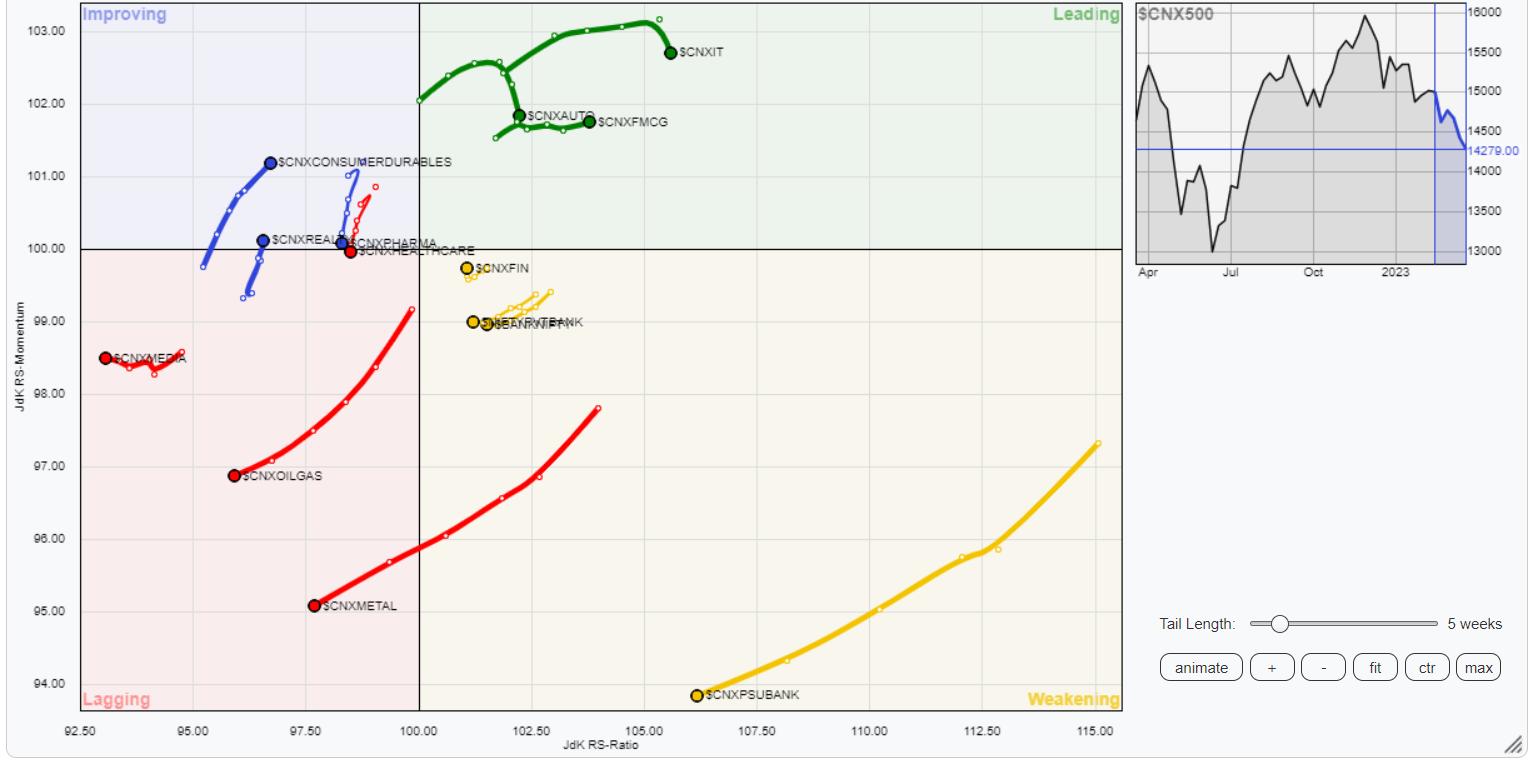
The analysis of Relative Rotation Graphs (RRG) shows that, this week, we have PSE, Infrastructure, Auto, IT, FMCG, and NIFTY MidCap 100 indices in the leading quadrant. Although a few among these are seen paring some relative momentum, the PSE, Infrastructure, and FMCG groups are likely to relatively outperform the broader NIFTY 500 Index.
The NIFTY Financial Services index is inside the weakening quadrant. However, some improvement is seen in its relative momentum. Besides this, BankNifty and the PSU Bank index are seen moving inside the weakening quadrant as well.
The NIFTY Metal, Media, Services Sector, Commodities, and Energy groups are inside the lagging quadrant. These groups are likely to relatively underperform the broader markets.
The Pharma and Realty Indexes are inside the improving quadrant, but they are on the verge of rolling back inside the lagging quadrant. The NIFTY Consumption index remains firmly placed inside the improving quadrant and may put up a resilient show over the coming week.
Important Note: RRG™ charts show the relative strength and momentum of a group of stocks. In the above Chart, they show relative performance against NIFTY500 Index (Broader Markets) and should not be used directly as buy or sell signals.
Milan Vaishnav, CMT, MSTA
Consulting Technical Analyst
www.EquityResearch.asia | www.ChartWizard.ae


