The previous week remained a technically damaging one, as the NIFTY violated a few important supports while closing on a negative note. The volatility, too, increased; however, this was on the expected lines. The past five days also saw the global markets dealing with the collapse of SVB (SVIB); the negative sentiment was seen across the globe in the equity markets. The trading range, too, remained wide; the NIFTY oscillated in a range of 679.75 points. In the end, despite the recovery seen on the last trading day, the headline index closed with a net loss of 312.85 points (1.80%) on a weekly basis.
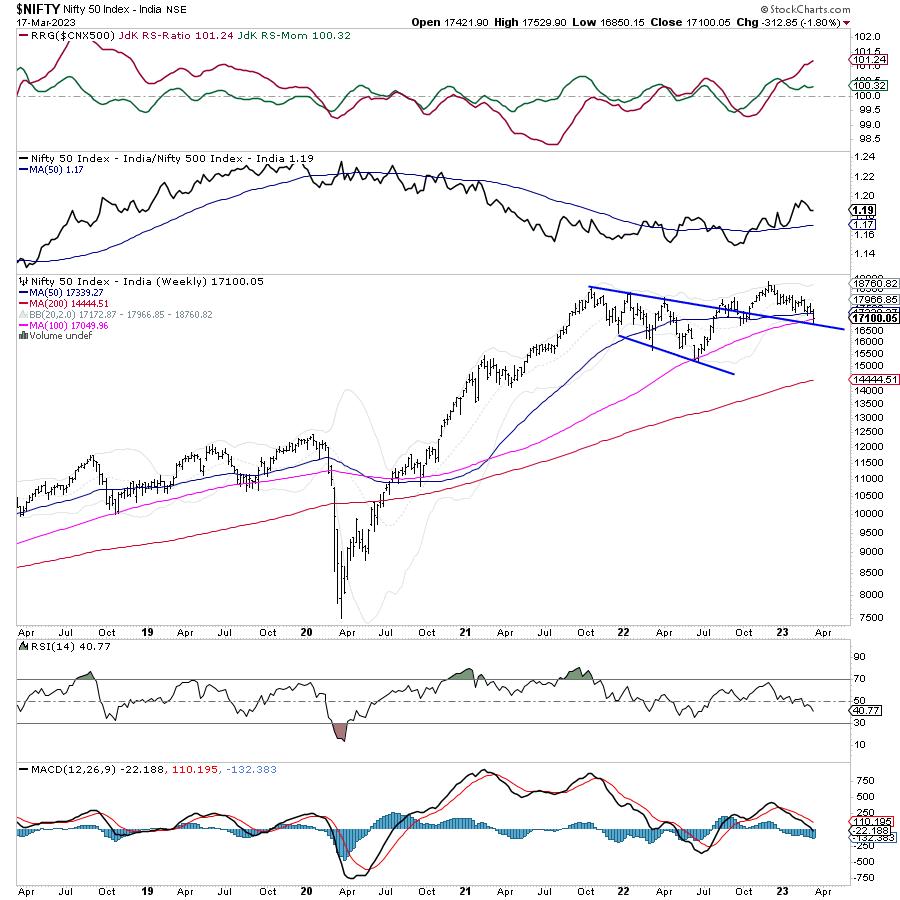
From a technical perspective, some damage was inflicted on the charts. The daily charts saw the important 200-DMA level violated; this level presently stands at 17451. Besides this, NIFTY also violated the 50-Week MA, which is at 17339. This makes the zone of 17340-17450 a strong resistance zone for the index. The NIFTY also went on to test the 100-Week MA, placed at 17050. The previous week's low of 16850-17050 marks an important support zone for the index. Regardless of the overhead resistance placed in the 17340-17450 zone, the markets will try to inch higher if the index can keep its head above the 16850-17000 level.
The coming week is again expected to see a slightly tepid start. The levels of 17250 and 17350 are likely to act as potential resistance points. The supports come in at 16900 and 16710 levels. The trading range will remain wider than usual.
The weekly RSI is 40.77; it has marked a new 14-period low, which is bearish. It remains neutral and does not show any divergence against the price. The weekly MACD is bearish and is still below the signal line.
The pattern analysis of the weekly charts shows that the NIFTY has violated the falling trend line pattern support by slipping below it. This falling trend line begins from 18604 and joins the subsequent lower tops. However, though this trend line support stands violated, the index has defended the 100-Week MA. It is currently placed at 17050 and remains an important support for the market on a closing basis.
Overall, the market is presently at a critical juncture, trapped in a narrow 300-400 points trading range. On one hand, it has dragged the supports lower to the 17350-17450 zone; on the other hand, it is just barely above the important support levels of 16850-17000. The coming week needs to be dealt with with a lot of caution; it would be crucial to see the behavior of the NIFTY vis-à-vis the zone of 16850-17000 levels, as keeping head above this will be extremely important. It is recommended to continue keeping leveraged exposures at modest levels while approaching the markets on a highly selective and stock-specific note.
Sector Analysis for the Coming Week
In our look at Relative Rotation Graphs®, we compared various sectors against CNX500 (NIFTY 500 Index), which represents over 95% of the free float market cap of all the stocks listed.
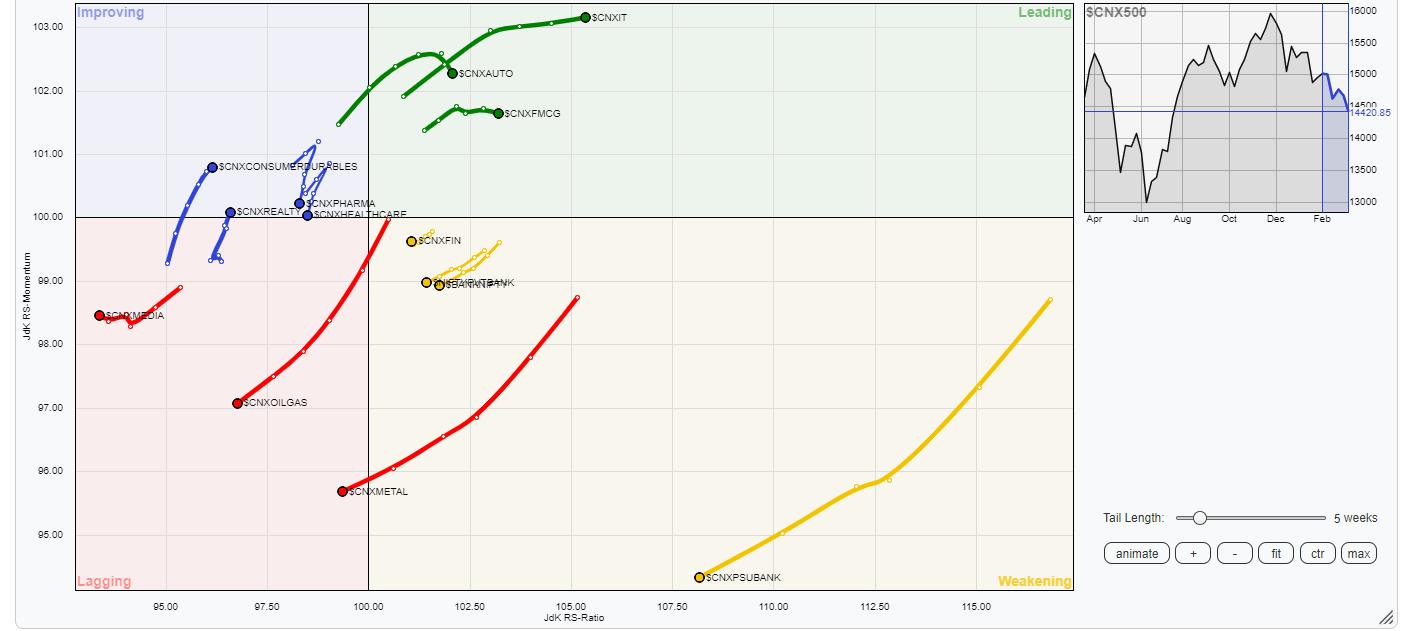
The analysis of Relative Rotation Graphs (RRG) does not show any major change in the sectoral setup in the markets. The NIFTY IT, Auto, FMCG, Midcap 100, and PSE Indices remain inside the leading quadrant of the RRG. The Infrastructure index has also rolled inside the leading quadrant; thsee groups collectively are expected to relatively outperform the broader markets.
The NIFTY PSU Bank, BankNifty, and Financial Services indices remain inside the weakening quadrant. They may struggle to keep up with their relative performance against the general markets.
The Nifty Commodities, Metal, and the Services Sector Indices have entered the lagging quadrant. They may relatively underperform the broader NIFTY 500 index. However, stock-specific shows cannot be ruled out in the metal pack given the behavior of the Dollar Index. Nifty Media and Energy indices also continue to languish inside the lagging quadrant.
Nifty Realty has rolled inside the improving quadrant, while the Consumption Index is also placed firmly in this quadrant. The Pharma Index is also inside the improving quadrant, but it is seen paring its relative momentum against the broader markets.
Important Note: RRG™ charts show the relative strength and momentum of a group of stocks. In the above Chart, they show relative performance against NIFTY500 Index (Broader Markets) and should not be used directly as buy or sell signals.
Milan Vaishnav, CMT, MSTA
Consulting Technical Analyst
www.EquityResearch.asia | www.ChartWizard.ae


