After taking a short breather last week, the markets resumed their up-move and went on to post a decent gain over the past five sessions. In the previous technical notes, concerns were raised about the persistently declining value of VIX and the consequent vulnerability that it lends to the markets. This week, as well, we saw the VIX testing its pre-pandemic 2020 lows by slipping below 11. The trading range of the NIFTY got a bit wider on the anticipated lines; it oscillated in the 476.65-point range. The NIFTY gained all five days; the benchmark index went on to post a decent gain of 440.95 points (+2.50) on a weekly basis. The month ended as well; NIFTY posted monthly gains of 705.25 points (+4.06%).
Things now continue to get more precarious than before. NIFTY has bounced off from the 200-DAY MA, which is placed at 17655, making this point an important support point for the Index. On the weekly charts, it has held 100-Week MA as a support, which is currently at 17214. This makes 17214-17655 a strong support area for the NIFTY in the event of any corrective move. Importantly, INDIAVIX continued its decline; this week, it slipped below 11 to close at 10.95 by losing 5.87% through the week. This is a precariously low level; INDIAVIX has also tested the pre-pandemic 2020 lows, and this now is overdue for a spike. While we continue to chase the up moves, one must never forget that any spike in the VIX can leave the markets extremely vulnerable to sharp profit-taking bouts.
The coming week is a short week. Indian markets would open on Tuesday, as Monday is a trading holiday on account of Maharashtra Day. The levels of 18130 and 18250 will act as important resistance points. The supports will come in at 17900 and 17710 levels. The trading range is likely to get wider this week.
The weekly RSI is 56.29; it has marked a new 14-period high, which is bullish. However, it continues to remain neutral against the price. The MACD is bearish and below the signal line; however, the narrowing Histogram shows this indicator on the verge of a positive crossover.
The pattern analysis of the weekly chart shows that, after taking a short breather, NIFTY has resumed its up-move and remains above the small falling channel that it had formed for itself. In broader terms, the combined reading of the daily and weekly chart shows that the zone of 17650-17250 is a strong support area for the index in the event of any retracement. Although there are no visible signs of any indications that the markets may correct, the dangerously low levels of the INDIAVIX have left the markets vulnerable to almost certain, overdue, sharp profit-taking bout over the coming days.
As we approach the coming week, we must be chasing the up-moves very cautiously. It is just a matter of time before we could see ourselves getting caught on the wrong side of the trade. The long players should very strictly trail their stop losses; any fresh purchases should be kept very stock-specific and preferably outside the front-line indices. It is time that we get ultra-selective in our approach toward the markets and protect all profits in an extremely vigilant manner. A cautious outlook is advised for the coming week.
Sector Analysis for the Coming Week
In our look at Relative Rotation Graphs®, we compared various sectors against CNX500 (NIFTY 500 Index), which represents over 95% of the free float market cap of all the stocks listed.
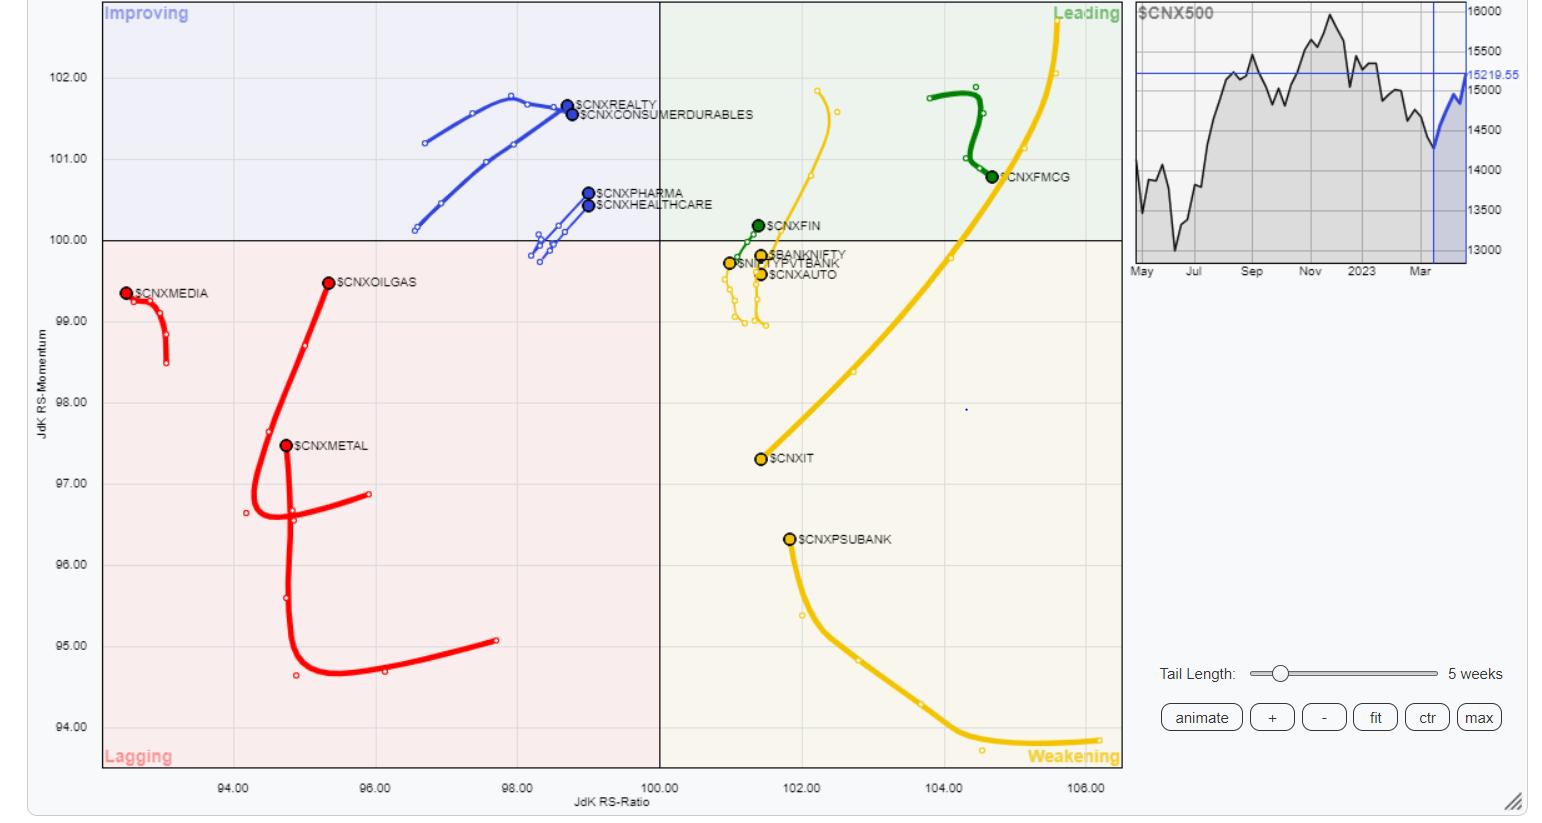
The analysis of Relative Rotation Graphs (RRG) shows that Nifty Midcap 100, Infrastructure, FMCG, Financial Services, and NIFTY PSE Indices are inside the leading quadrant. Though these groups may continue to relatively outperform the broader markets, we can see many are giving up on their relative momentum and taking a breather.
BankNifty, NIFTY PSU Bank, Auto, and the IT indices are inside the weakening quadrant. Among these four, while IT and Auto continue to rotate southwest, the BankNifty and PSU banks are seen sharply improving on their relative momentum.
NIFTY Metal and Media are inside the lagging quadrant. Though they are also seen improving on their relative momentum, they may continue to relatively underperform the broader markets.
The commodities index has rolled inside the improving quadrant. The NIFTY Energy, Consumption, Pharma, and Realty Indices are also inside the improving quadrant and firmly maintaining their relative momentum against the broader markets.
Important Note: RRG™ charts show the relative strength and momentum of a group of stocks. In the above Chart, they show relative performance against NIFTY500 Index (Broader Markets) and should not be used directly as buy or sell signals.
Milan Vaishnav, CMT, MSTA
Consulting Technical Analyst
www.EquityResearch.asia | www.ChartWizard.ae


