After ending with gains for three weeks in a row, the markets took a breather this time by ending modestly in the red. In the previous technical note, it was mentioned that the NIFTY is not only over-extended on the shorter timeframe charts, but the VIX is also hovering around one of its lowest levels seen in the recent past. It was also mentioned that, at any point in time, the indices may look to correct; if not sharply, then at least modestly. The trading range remained in line with expectations; the index oscillated in a 309-point range through the week. After consolidating for the major part of the week and coming off from its high point, the benchmark index NIFTY ended with a net loss of 203.95 points (-1.14%) on a weekly note.
Over the coming week, it is important to keep a very cautious and close tab on a couple of things from a technical perspective. In particular, the INDIAVIX. This volatility gauge has closed at a new low of 11.63 after coming off by 2.33% on a weekly basis, violating 2021 the low of 11.70. With this being persistently at precariously low levels, the markets have been left vulnerable to sharp profit-taking bouts from current and higher levels. The week will also see the expiry of the monthly derivative series; the 17700 strike has the highest built-up of Call OI, and this is set to act as a strong resistance point for the Index.
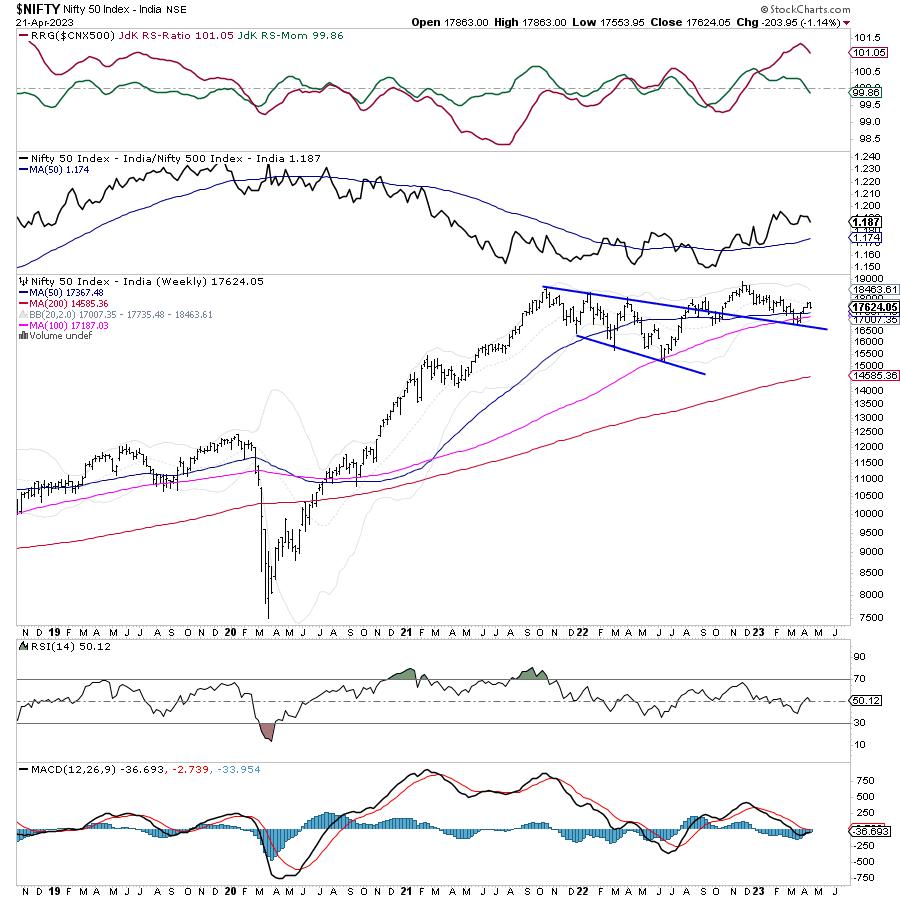
The next will see the levels of 17700 and 17865 acting as strong resistance points. Supports come in at 17500 and 17380.
The weekly RSI is 50.15; it remains neutral and does not show any divergence against the price. The weekly MACD remains bearish and below the signal line.
The pattern analysis shows that the high point of the previous week, i.e. 17863, has almost become an immediate top for the short-term; no meaningful up-move is likely unless this level is taken out. Besides this, an important support zone for the NIFTY falls in the 17367-to-17187 range; that is, the 50-week and the 100-Week MA of NIFTY. However, the possibility of testing these levels would increase only if the index ends up violating 17500 levels.
As we approach the markets over the coming days, we will need to do it on a very cautious note. The long-only market participants will need to focus on finding opportunities from the broad market universe; it would be imprudent from this time one to chase the up-move in the indices and its constituents. Some relative outperformance is expected from the defensive space like FMCG, Consumption, Pharma, PSE, etc. A highly selective approach is advised for the coming week.
Sector Analysis for the Coming Week
In our look at Relative Rotation Graphs®, we compared various sectors against CNX500 (NIFTY 500 Index), which represents over 95% of the free float market cap of all the stocks listed.
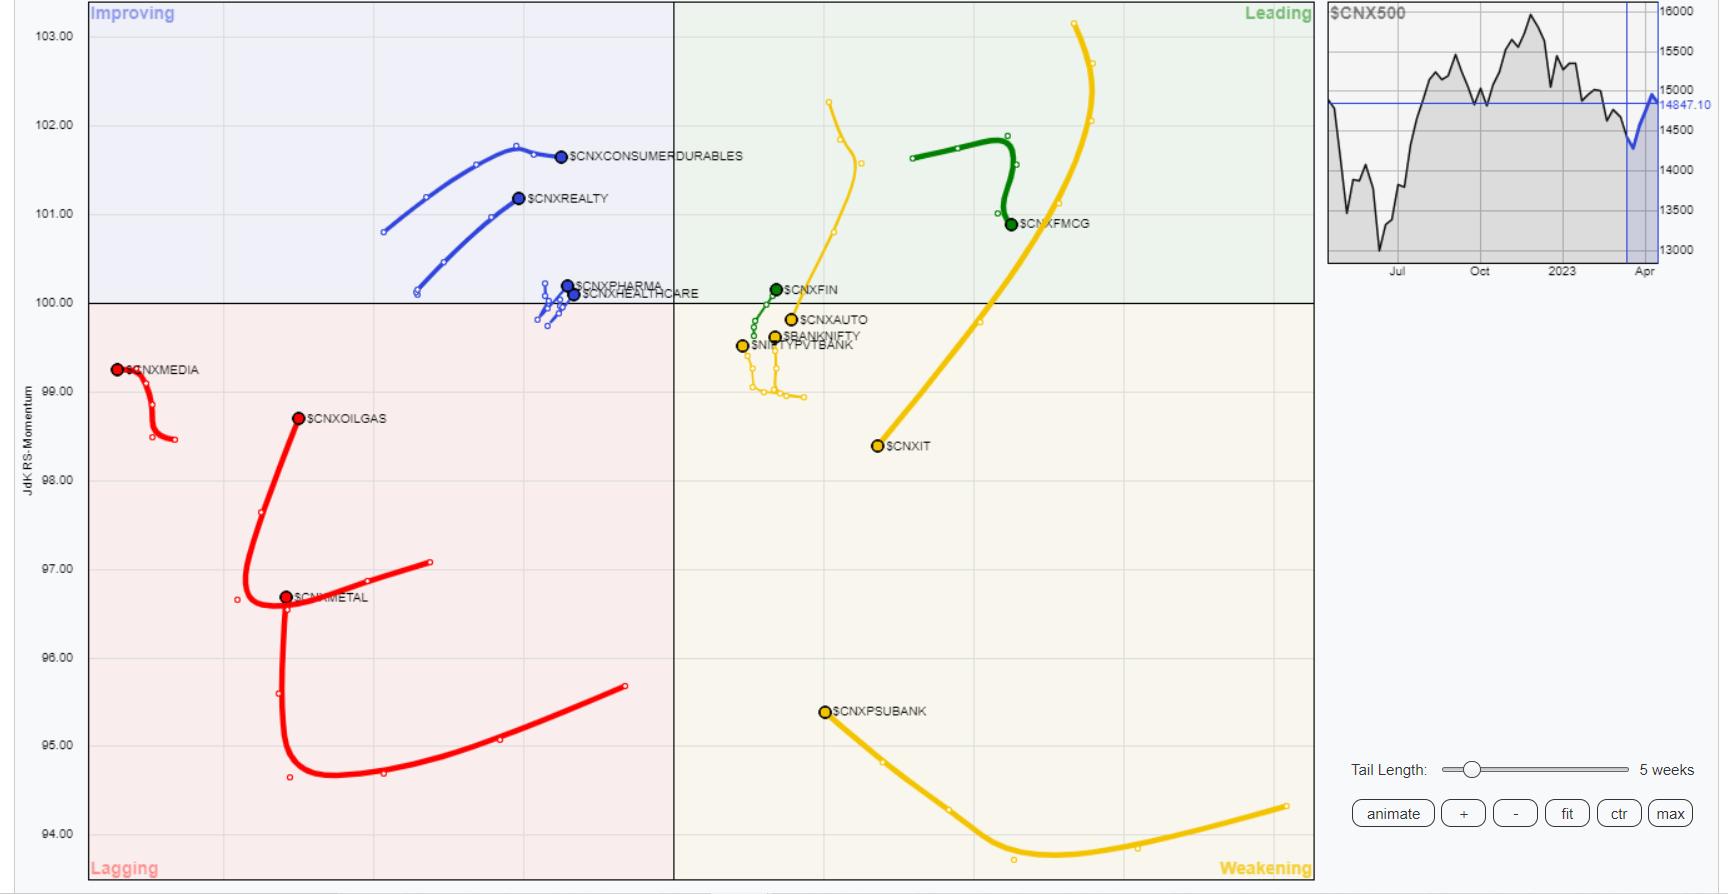
The analysis of Relative Rotation Graphs (RRG) does not show any major change in the sectoral setup over the previous week. We have NIFTY Infrastructure, Midcap 100, and the PSE index placed inside the leading quadrant, and they are expected to relatively outperform the broader markets. The Financial Services Index has rolled inside the leading quadrant.
The IT and the Auto Index have rolled inside the weakening quadrant. This may well end their phase of relative outperformance, and we may see these pockets taking a breather. BankNifty and PSU Bank indices are also inside the weakening quadrant. However, they are seen improving on their relative momentum against the broader markets.
Media and Metal Indices are seen in the lagging quadrant; they all appear to be trying to consolidate and put a potential base in place by showing improvement in their relative momentum against the broader markets. The NIFTY Services sector index is also inside the lagging quadrant. All these groups are likely to relatively underperform the broader NIFTY500 Index.
The Energy, Pharma, and Commodities indices have rolled inside the improving quadrant. The Consumption Index and the Realty Index is also seen rolling firmly inside the improving quadrant. These groups are likely to see resilient performance over the coming week.
Important Note: RRG™ charts show the relative strength and momentum of a group of stocks. In the above chart, they show relative performance against NIFTY500 Index (Broader Markets) and should not be used directly as buy or sell signals.
Milan Vaishnav, CMT, MSTA
Consulting Technical Analyst
www.EquityResearch.asia | www.ChartWizard.ae


