In a week that was shortened by Good Friday, the Indian equities extended their gains as they moved above crucial resistance points. The NIFTY had a strong and positive previous week, but had halted its up move near important resistance levels. Over the past four sessions, the index managed to move past those levels while remaining in the intermediate falling channel that it is currently trading in. The trading range remained a bit narrower; the NIFTY moved in a 325.95 points range. While staying largely bullish, the headline index ended with a net gain of 239.40 points on a weekly note.
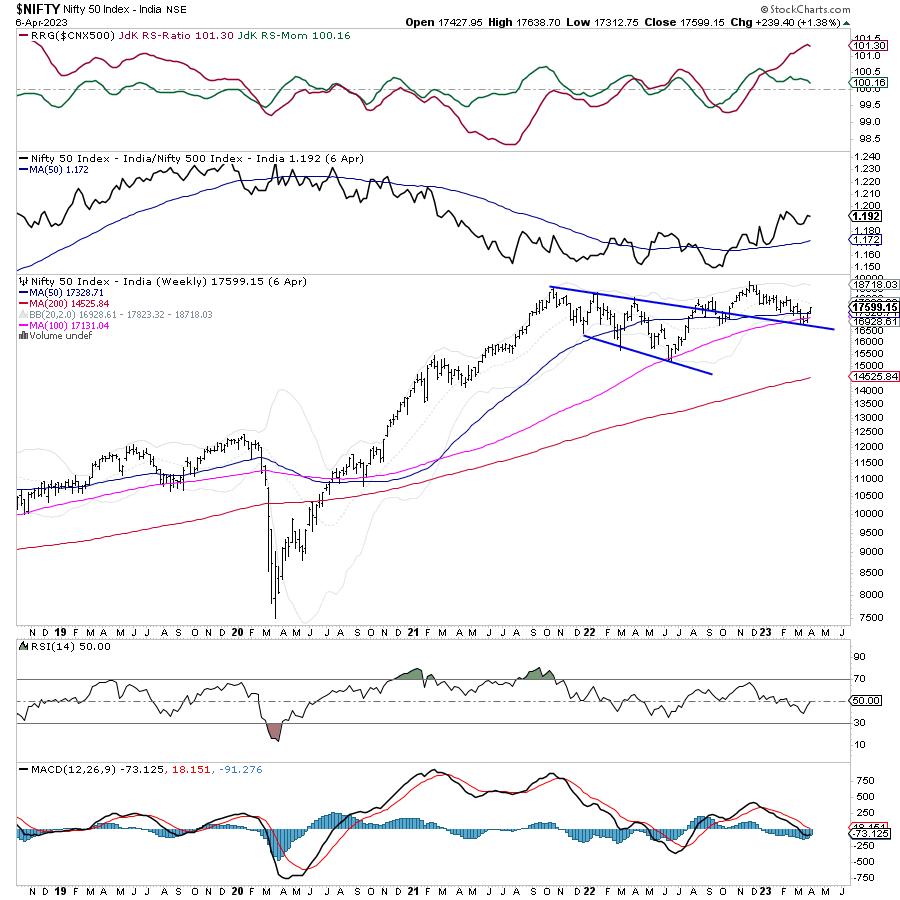
The coming week remains shortened as well, with Friday being a trading holiday on account of Dr. Baba Saheb Ambedkar Jayanti. The previous weekly closing had seen the NIFTY closing the 50-Week MA; this week, the index has moved above this point. The 50-Week MA currently stands at 17328. Aside from this, the Index has also moved above the falling trend line that was posing resistance; however, the index remains within the intermediate falling channel that it has created for itself. Importantly, volatility has made a new low; INDIAVIX plunged by another 8.79% to 11.80. This is very near to the low tested in July 2021. This is something traders will need to be very concerned about and cautious of.
Monday is likely to see a quiet start, and the coming week will see the levels of 17700 and 17865 acting as resistance points. The supports come in at 17480 and 17350 levels.
The weekly RSI is 50; it stays neutral and does not show any divergence against the price. The weekly MACD is bearish and remains below its signal line.
The pattern analysis presents a mixed picture. The NIFTY has managed to move comfortably above the 50-Week MA which is presently placed at 17328. The Index has also moved and stayed above the falling trend line that was posing resistance to the NIFTY over the previous week. This trend line begins from the high of 18600 and joins the subsequent lower tops while extending itself. On the other hand, the index is still within the intermediate falling channel that it has created for itself; it is seen testing those levels currently and is likely to find resistance slightly above the current levels.
As we approach the upcoming shortened week, we will need to keep a very close eye on volatility. The INDIAVIX is at one of its lowest levels again; this not only reflects the complacency of the market participants, but also leaves traders exposed to violent profit-taking bouts from the higher levels. Perhaps we are at a stage where we need to stop chasing the up moves and focus on utilizing any moves on the upside to protect profits on the long positions. It is recommended to continue keeping positions hedged and overall exposures at modest levels, while adopting a cautious outlook over the coming week.
Sector Analysis for the Coming Week
In our look at Relative Rotation Graphs®, we compared various sectors against CNX500 (NIFTY 500 Index), which represents over 95% of the free float market cap of all the stocks listed
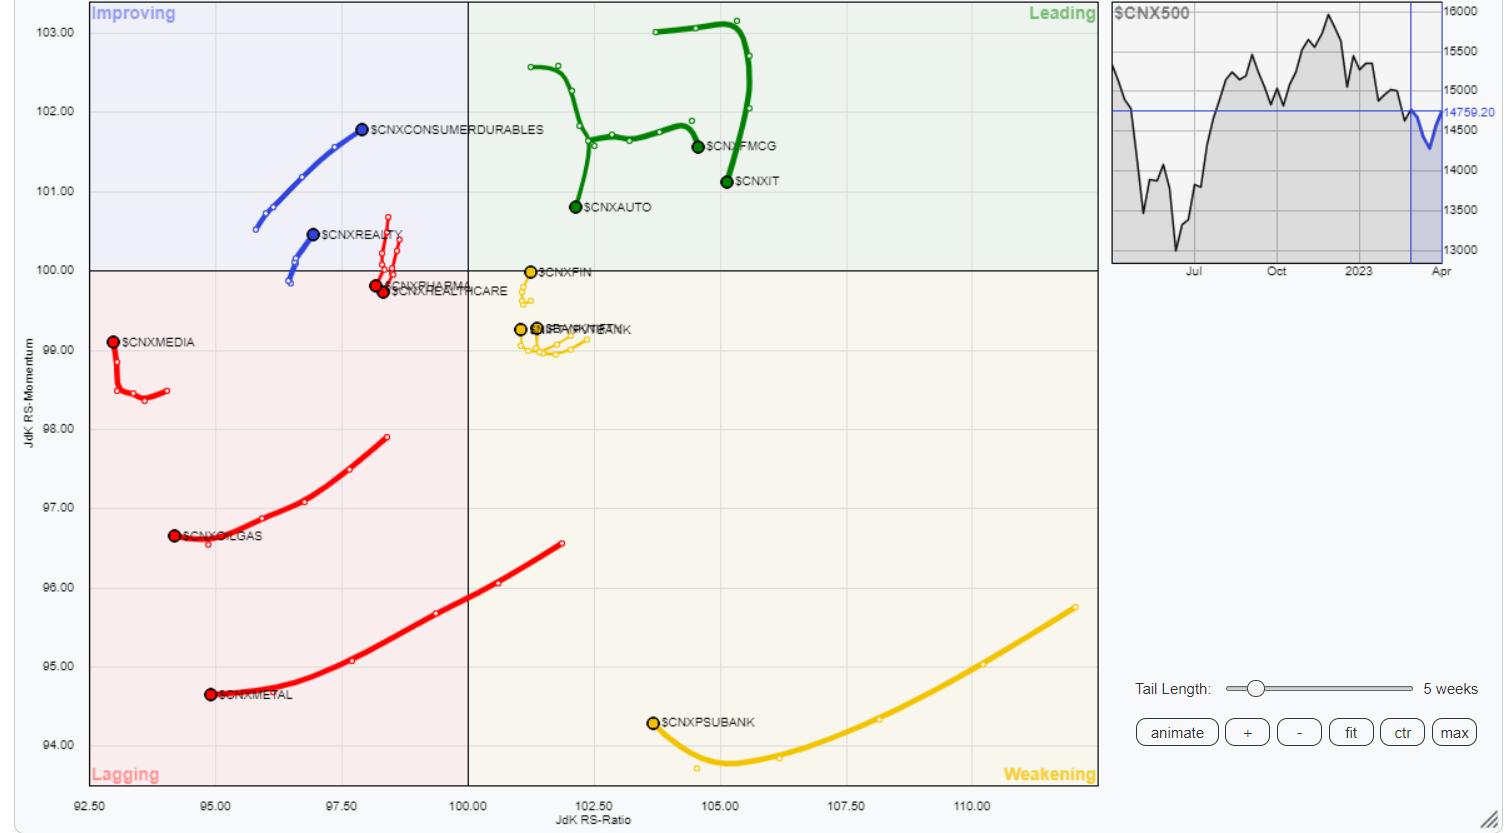
The analysis of Relative Rotation Graphs (RRG) shows that, while NIFTY IT, Auto, FMCG, and PSE indices are inside the leading quadrant, they sharply giving up on their relative momentum. NIFTY Infrastructure and MidCap 100 indices are inside the leading quadrant; they look firmly placed and are expected to relatively outperform the broader markets.
While staying inside the weakening quadrant, the NIFTY Financial Services, Banknifty, and PSU Banks are seen improving on their relative momentum.
Pharma Index has rolled inside the lagging quadrant. NIFTY Metal and Commodities also remain inside the lagging quadrant, along with the Energy and Media Group. However, these indices appear to be slightly improving their relative momentum. They have a long way to go before they start relatively outperforming the broader markets.
NIFTY Consumption and Realty Index remain in the improving quadrant of the RRG.
Important Note: RRG™ charts show the relative strength and momentum of a group of stocks. In the above chart, they show relative performance against NIFTY500 Index (Broader Markets) and should not be used directly as buy or sell signals.
Milan Vaishnav, CMT, MSTA
Consulting Technical Analyst
www.EquityResearch.asia | www.ChartWizard.ae


