The Indian equity markets extended their gains for the third week in a row; however, they have ended up getting a bit over-extended on the charts. All four trading sessions in the shortened week ended in gains; in fact, NIFTY has closed with gains for nine sessions in a row with VIX staying at one of its lowest levels seen in the recent past. The trading range remained narrow; the index moved in 244 points in the past four sessions. The markets have largely stayed bullish through the week; the benchmark index ended with a net gain of 228.85 points (+1.30%) on the weekly basis.
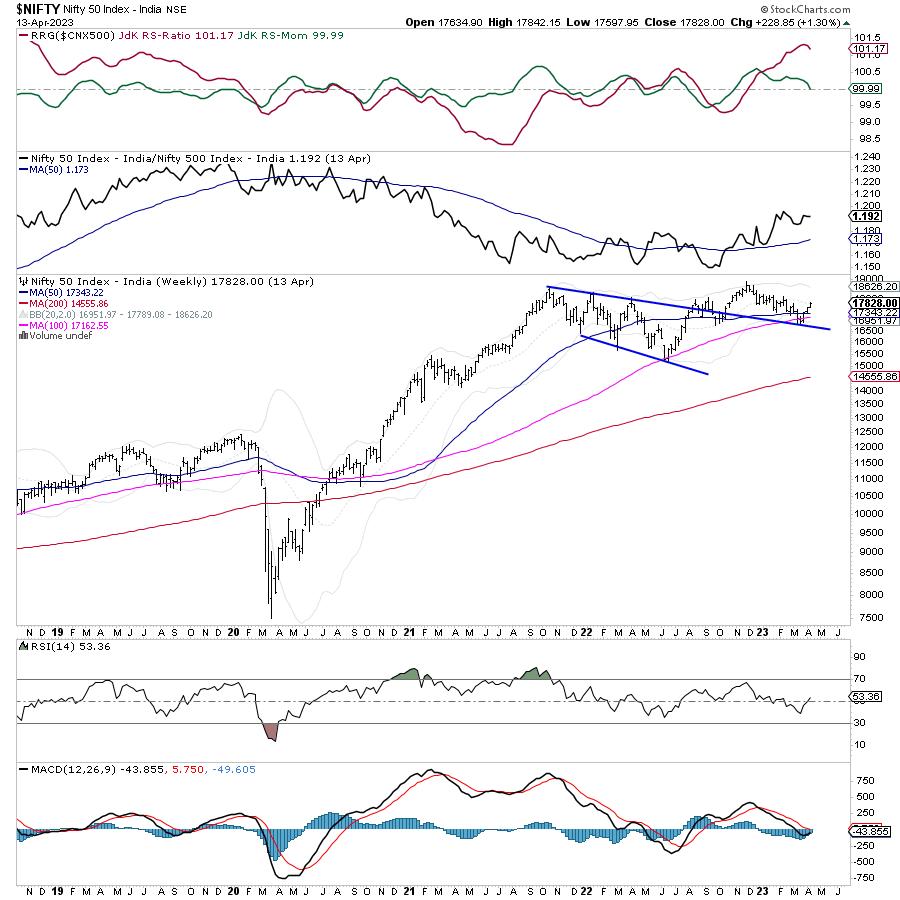
The coming week remains once again important; the INDIAVIX remains at one of the lowest levels seen in the recent past while it remained largely flat through the week. The NIFTY has attempted to move out of the small falling channel that it has formed for itself; it has also raised the support levels higher in the process. The Index has also crossed above the 20-Week MA which stands at 17789 by closing a notch above that point. The supports have been dragged higher at 17300 levels. The markets stare at some imminent corrective retracement after unabated up-move; the low levels of INDIAVIX will continue to stay a concern for the immediate short term.
Monday is likely to see a tepid start to the week. The levels of 18000 and 18180 will act as immediate resistance points; the supports come in a bit lower at 17500 and 17380 levels. The trading range for the coming week is expected to get wider again than usual.
The weekly RSI is 53.36; it continues to remain neutral and does not show any divergence against the price. The weekly MACD stays bearish and below its signal line. No major formation was seen on the Candles.
The pattern analysis of the weekly charts shows that the NIFTY has rebounded off the 100-Week MA after a minor violation of that level. The 100-Week MA presently stands at 17163. This point followed by the 50-Week MA which is placed at 17343 makes 17300-17100 a very important support zone for the markets in the near term.
The coming week needs to be approached with a heightened degree of caution. The markets have seen an unabated rise over the past nine sessions. On top of it, INDIAVIX stands at 11.91; this level remains one of the lowest levels seen in the recent past. Any spike in the VIX will leave traders exposed and vulnerable to violent profit-taking bouts from the current levels. From a technical standpoint, the markets remain due for some imminent corrective retracement; this makes any more upsides capped in nature.
Any up-move that we see from the current levels needs to be used for protection profits on the positions. From now on, emphasis must be placed on using the moves in the markets to book profits and take money off the table; mindlessly chasing the up moves is something that needs to be avoided. A highly cautious approach is advised for the coming week.
Sector Analysis for the coming week
In our look at Relative Rotation Graphs®, we compared various sectors against CNX500 (NIFTY 500 Index), which represents over 95% of the free float market cap of all the stocks listed
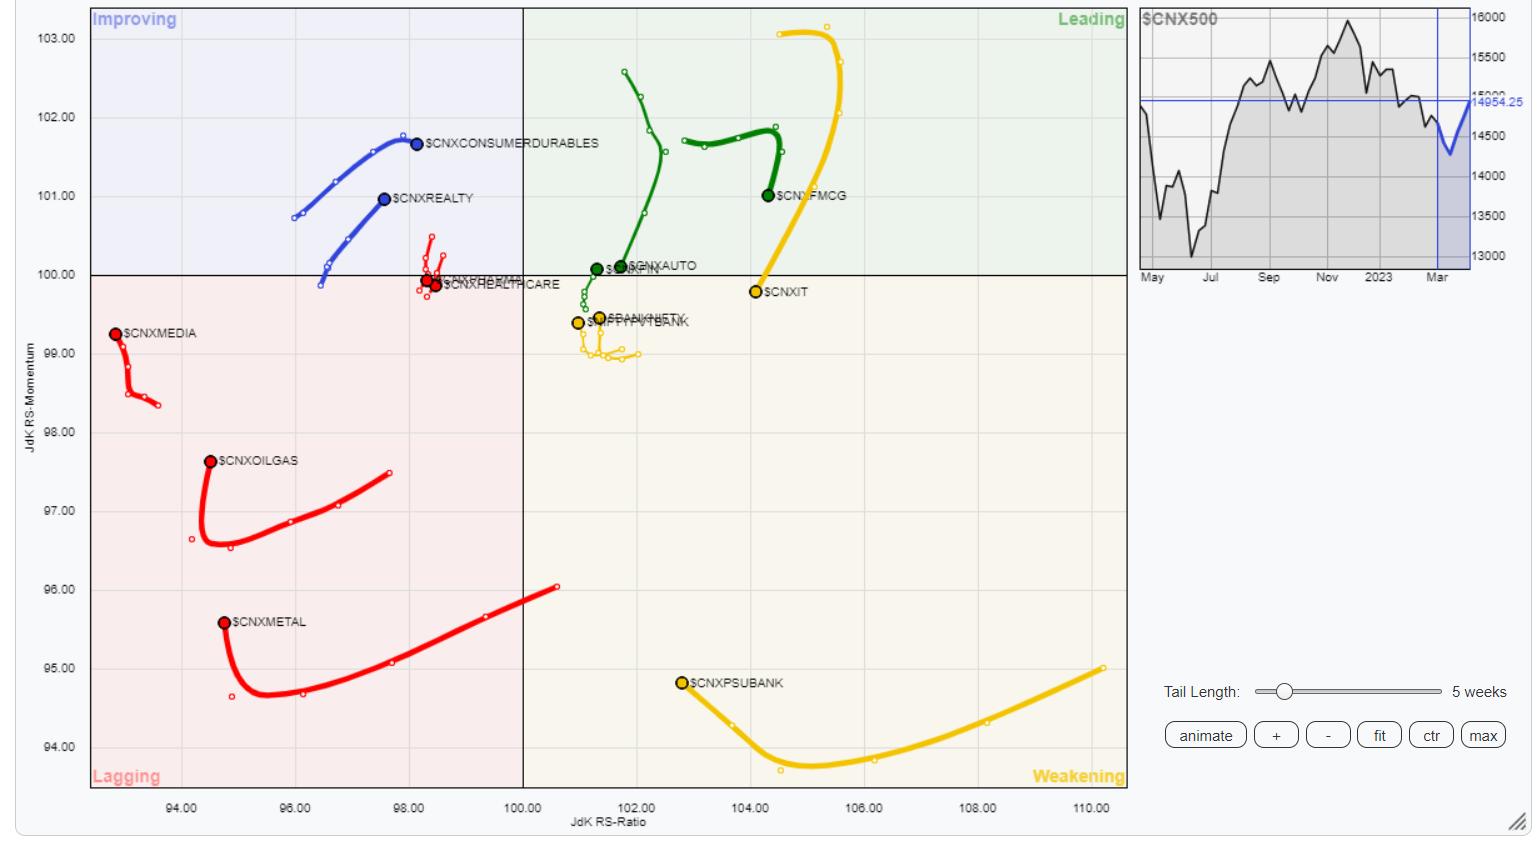
The analysis of Relative Rotation Graphs (RRG) shows that NIFTY Infrastructure, Midcap 100, and PSE index are placed inside the leading quadrant and they are expected to relatively outperform the broader markets. The AUTO, IT, and FMCG indices are also inside the leading quadrant but they appear to be taking a breather and giving up on their relative momentum.
Banknifty, PSU Bank, and Financial Services index are also inside the weakening quadrant. However, they are seen improving on their relative momentum against the broader markets.
NIFTY Commodities, Energy, Pharma, Media, and Metal Indices are seen in the lagging quadrant; they all appear to be trying to consolidate and put a potential base in place. The NIFTY Services sector index is also inside the lagging quadrant. All these groups are likely to relatively underperform the broader NIFTY500 Index.
The Consumption Index is inside the improving quadrant; the Realty Index is also seen rolling firmly inside the improving quadrant. These groups are likely to see resilient performance over the coming week.
Important Note: RRG™ charts show the relative strength and momentum of a group of stocks. In the above Chart, they show relative performance against NIFTY500 Index (Broader Markets) and should not be used directly as buy or sell signals.
Milan Vaishnav, CMT, MSTA
Consulting Technical Analyst
www.EquityResearch.asia | www.ChartWizard.ae


