Despite the volatile moves during the four sessions of this week's shortened frame, we ended on a very flat note for the second time in a row. The trading range remained slightly wider compared to the previous week. Compared to the 274.55-point range in the week before, the index this week oscillated in a 342.15-point range. The highlight of the week was the surging US 10-YR yields, which put pressure on global equities, and India was resilient, but no different. The markets went on to test key support levels on the weekly charts and experienced a technical rebound from there. Finally, the headline index closed with a net gain of 15.20 points (+0.08%) on a weekly basis.
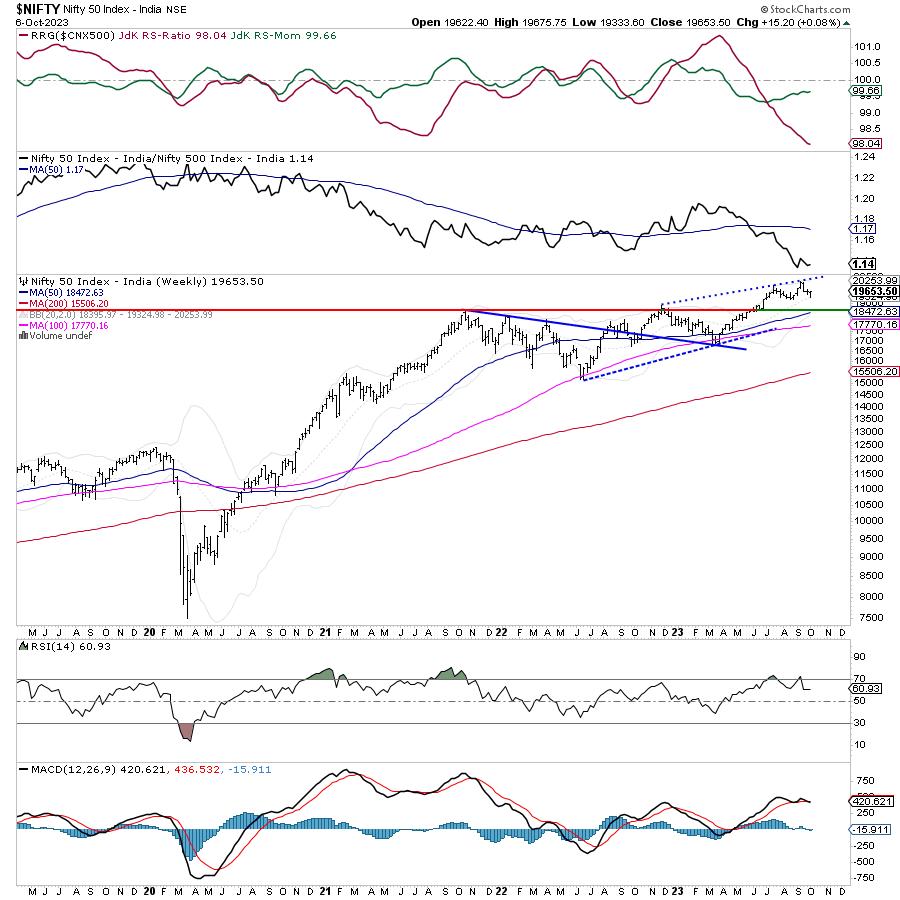
The highlight of the week was yet another decline in INDIAVIX on a week-on-week basis. As of Friday's close, INDIAVIX declined 10.06% to 10.30, and now it hovers near one of its lowest levels seen in its lifetime. Keeping everything else aside, the precariously low levels of VIX continue to make the markets vulnerable to sharp moves, even if the broader levels on the charts are not violated. Even if the technical pullback that was seen during the last two sessions extends itself, we will need to keep an eagle-eye on VIX, which has all the potential to not only infuse volatility on a large scale, but also trigger violent profit-taking moves from higher levels. The NIFTY tested and rebounded from the 20-Week MA; this level, which is placed at 19324, is now an important support on a closing basis.
We are likely to see the coming week getting flagged off on a positive note, with the levels of 19780 and 19900 acting as potential resistance points. The supports come in at 19500 and 19320 levels.
The weekly RSI is 60.93; it remains neutral and does not show any divergence against the price. The weekly MACD has shown a negative crossover; it is now bearish and below its signal line. A candle with a long lower shadow appeared; its occurrence near the support level of 20-week MA adds credibility to this support level, at least for the short term. However, given the very small real body, this candle can also be called a spinning top, which indicates the indecisive behavior of the market participants.
The pattern analysis shows that, on the daily chart, the index has managed to cross above the 50-DMA, which is placed at 19607. Therefore, looking from a very short-term perspective, keeping your head above this point will be important for NIFTY to avoid weakness. On the weekly charts, the Index has rebounded off its 20-week MA, which is at 19324. This level is expected to act as a major support on a closing basis; if violated, it will invite incremental weakness for the markets.
Overall, the markets may have rebounded from their weekly lows and also might extend their technical rebound at the beginning of the week, but the current technical picture suggests that we will need to stay extremely vigilant at higher levels. The low levels of VIX remain a concern, and there is a possibility of volatility spiking over the coming days and weeks. It would be prudent to seek a safe approach and stay invested in low-beta stocks and also limit exposures to defensive pockets like PSEs, Pharma, IT, etc. In the event of the technical rebound extending itself, it will be of paramount importance to keep protecting profits at higher levels. While keeping overall leverage at modest levels, a cautious and selective approach is advised for the coming week.
Sector Analysis for the Coming Week
In our look at Relative Rotation Graphs®, we compared various sectors against CNX500 (NIFTY 500 Index), which represents over 95% of the free float market cap of all the stocks listed.
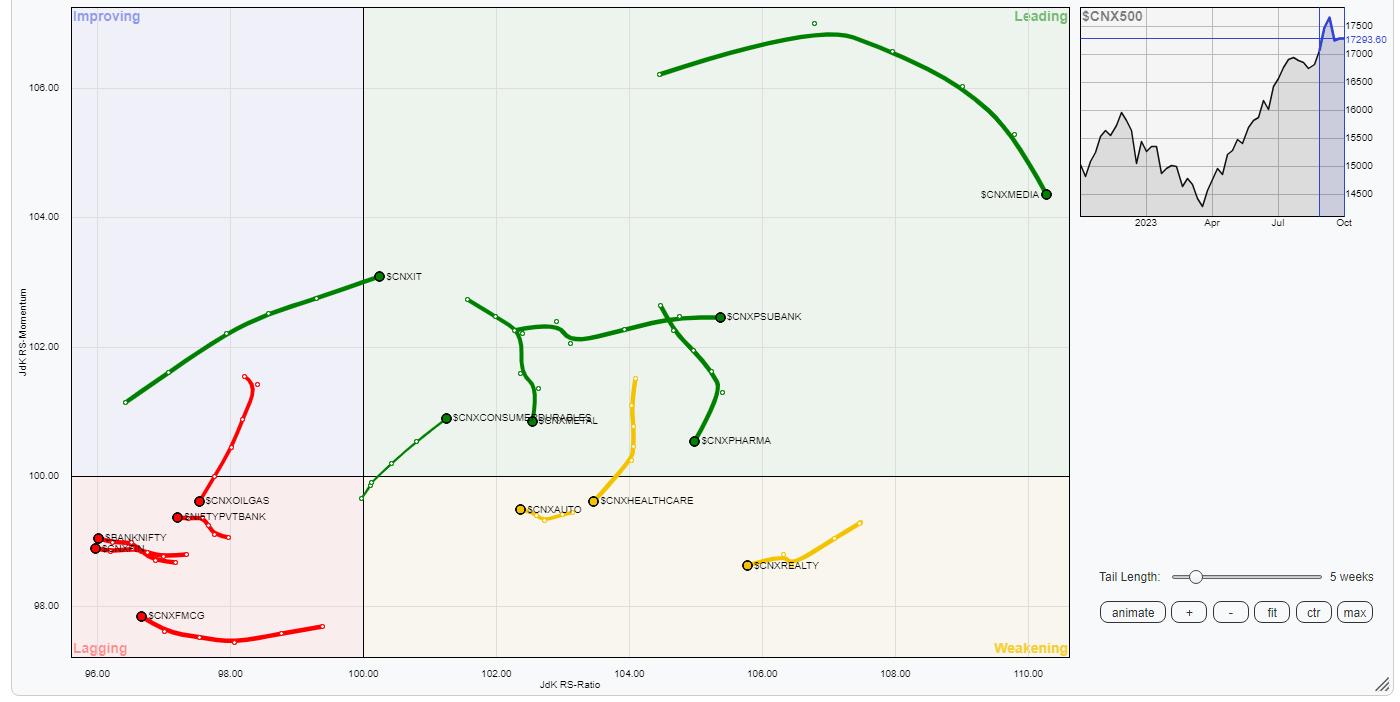
Relative Rotation Graphs (RRG) show that the IT index has rolled inside the leading quadrant. Besides this, the Nifty Media, PSUBank, PSE, Metal, Pharma, Energy, and Midcap indices are inside the leading quadrant. A few like Energy, Metal, Media, etc., are showing a deceleration in their relative momentum, but these groups are likely to overall relatively outperform the broader markets.
The Nifty Realty and Auto indices are inside the weakening quadrant.
The Nifty Bank Index continues to languish inside the lagging quadrant, along with the Financial Services index. These groups may relatively underperform the broader markets. The FMCG and Consumption indices are also inside the weakening quadrant, but they are seen improving their relative momentum against the broader markets.
The Nifty Commodities and Services Sector indices are inside the improving quadrant.
Important Note: RRG™ charts show the relative strength and momentum of a group of stocks. In the above Chart, they show relative performance against NIFTY500 Index (Broader Markets) and should not be used directly as buy or sell signals.
Milan Vaishnav, CMT, MSTA
Consulting Technical Analyst
www.EquityResearch.asia | www.ChartWizard.ae


