In the previous technical note, it was mentioned that the volatility gauge INDIAVIX had stayed at its lowest levels, and this setup was keeping the markets vulnerable to profit-taking bouts from the current levels.
Over the past five days, the markets showed some signs of profit-taking, but at the same time, they largely consolidated and traded in a range. The trading range stayed modest at 362 points as the index oscillated within this range. The global equities remained largely stable, but some stress stayed visible. Overall, the markets continued to consolidate while defending important support levels; the headline index closed with a net gain of 97.55 points (+0.50%) on a weekly basis.
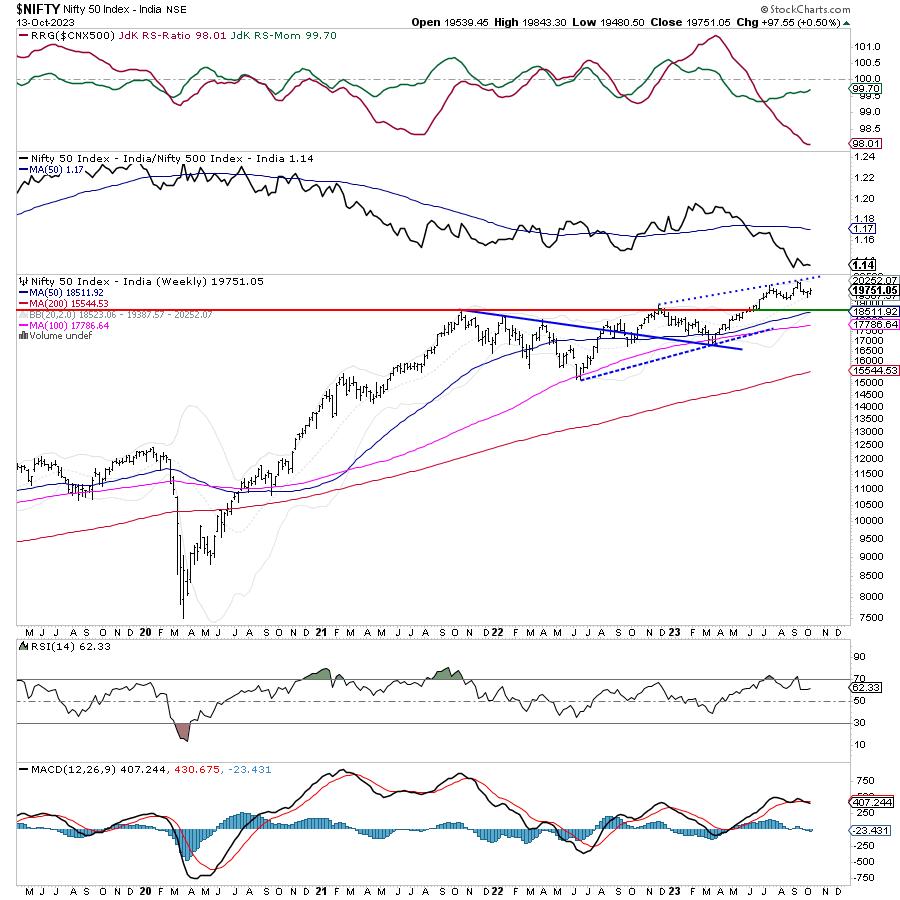
From a technical perspective, in the week before this one, the NIFTY had tested the 20-week MA and had taken support by rebounding from that point. The 20-week MA, currently at 19387, remains an important support for the markets on a closing basis. The markets will consolidate so long as they keep their head above this point; any violation of this level will make the markets incrementally weaker. The volatility gauge, INDIAVIX, showed a marginal increase of 3.08% to 10.62 on a weekly basis. It remains within a striking distance of 10.14, the lowest level seen on this indicator so far. This remains a point of concern, as this keeps the markets exposed to profit-taking bouts, as mentioned earlier.
Monday is likely to see a tepid start to the week; the levels of 19880 and 19950 are expected to act as potential resistance points. The supports come in at the 19500 and 19380 levels.
The weekly RSI is 62.33; it remains neutral and does not show any divergence against the price. The weekly MACD is bearish and below its signal line. A bullish engulfing candle has emerged; however, it is of little significance, as it has emerged with an overall uptrend after just a minor decline.
The pattern analysis of the weekly charts shows that the markets are unlikely to see any runaway up move; any extension of the move on the higher side will find resistance to the upward-rising trend line, which begins from 18900 and joins subsequent higher tops. On the lower side, the NIFTY has important support at 20-week MA currently placed at 19387. So long as this is protected, the index will consolidate in a defined range, and it will get incrementally weaker if this important support level is violated on a closing basis.
All and all, this is the time when we get cautious about the markets. Even if the move gets extended over the coming days, it would be prudent to use such moves on the upside to vigilantly protect profits at higher levels. Fresh purchases should be kept highly selective and within defensive and low-beta pockets. A cautious outlook is advised over the coming week, keeping overall exposures at modest levels.
Sector Analysis for the Coming Week
In our look at Relative Rotation Graphs®, we compared various sectors against CNX500 (NIFTY 500 Index), which represents over 95% of the free float market cap of all the stocks listed.
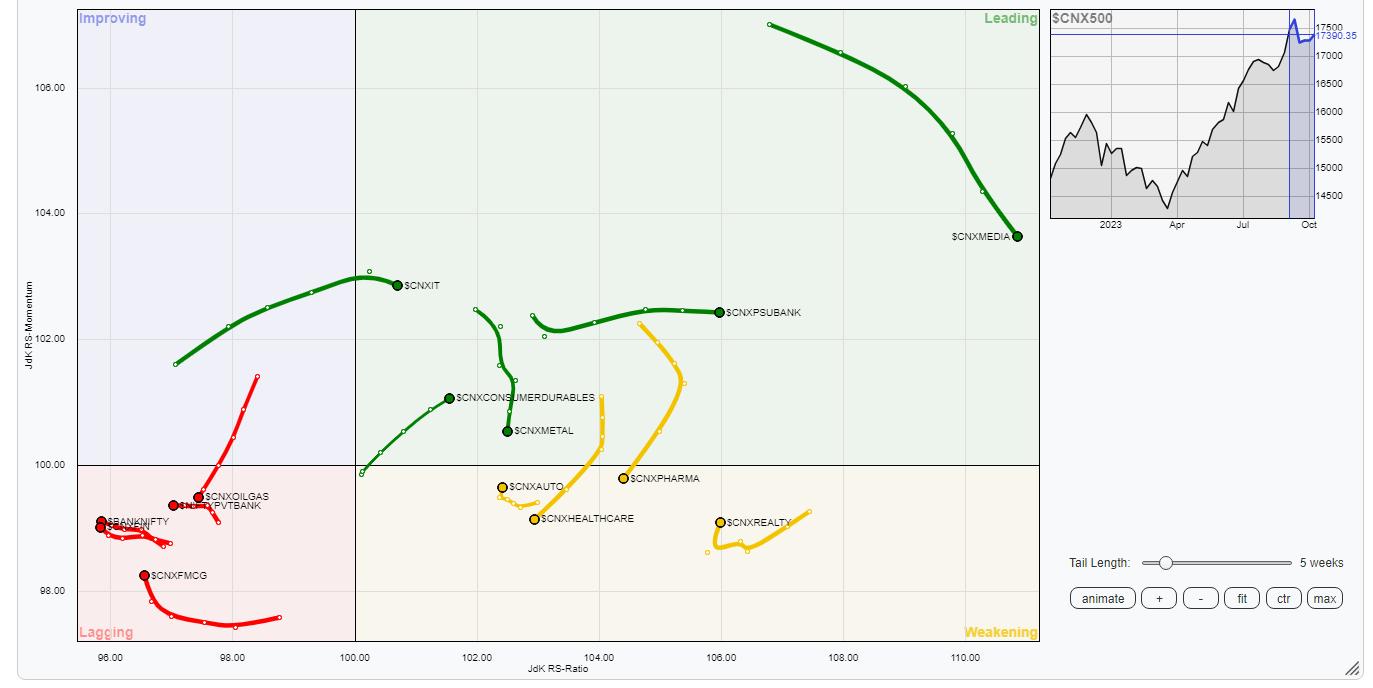
Relative Rotation Graphs (RRG) show that the NIFTY Pharma Index, which was inside the leading quadrant until now, has rolled inside the weakening quadrant. Besides this, the IT, Energy, Midcap100, Media, Metal, PSE, PSU Bank, and Infrastructure indices are also inside the leading quadrant. Of these groups, all except PSE, PSU Bank, and Infrastructure are showing a slowdown and paring of their relative momentum against the broader markets.
Along with the Pharma index, the Realty and the Auto Index are also inside the weakening quadrant. However, both of these indices are showing improvement in their relative momentum.
NIFTY Bank and Financial Services index are seen languishing inside the lagging quadrant. The FMCG and the Consumption index are also inside the lagging quadrant, but they are seen improving their relative momentum against the broader NIFTY 500 index.
The NIFTY Commodities index and Services Sector index are inside the improving quadrant.
Important Note: RRG™ charts show the relative strength and momentum of a group of stocks. In the above Chart, they show relative performance against NIFTY500 Index (Broader Markets) and should not be used directly as buy or sell signals.
Milan Vaishnav, CMT, MSTA
Consulting Technical Analyst
www.EquityResearch.asia | www.ChartWizard.ae


