In the previous technical note, during our analysis of the patterns of the NIFTY's weekly chart, it was mentioned that the Index has achieved a full throwback. This occurs when the instrument gives up the breakout gains entirely and retests the original breakout point which acts as a strong support at least once. NIFTY ended up testing the 18850-18900 zone in the week before this one. The markets had a copy week, with it swinging both ways; it has made a strong attempt and has held the previous week's low of 18837 and formed a higher low. The Nifty traded in a 336-point range and has attempted to find a base for itself.
In the end, the headline index closed with a net gain of 183.35 points (+0.96%) on a weekly basis.
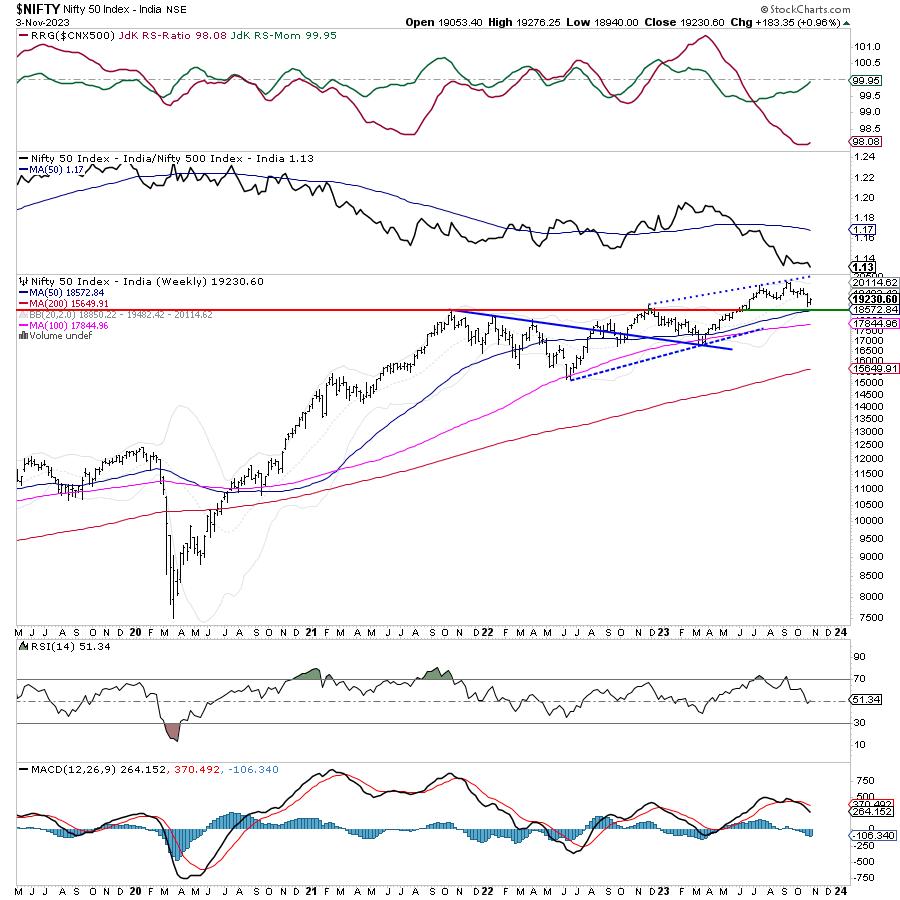
From a technical perspective, the markets have formed an Inside Bar on the charts, as NIFTY has formed a lower high and higher low. Having said this, what's more important is the fact that the NIFTY has defended the strong support zone of the and 18850-18900 levels; as of now, unless violated, this zone remains a very strong support zone for the NIFTY. The concerning factor is the volatility, as represented by INDIAVIX. Throughout the week, it stayed choppy, but, on a weekly note, it remained unchanged. The VIX closed at 10.88 with a change of just -0.21% on a weekly note. Any spikes here can once again leave the markets vulnerable to violent selloff; however, as of now, the zone of 18850-18900 remains crucial support to keep an eye on. So long as the NIFTY stays above this, it will continue staying in a broad trading range.
Expect a buoyant start to the trade on Monday; the levels of 19400 and 19580 are likely to act as potential resistance points. The supports are likely to come in at 19000 and 18780 levels.
The weekly RSI is 51.34; it remains neutral and does not show any divergence against the price. The weekly MACD is bearish and remains below its signal line.
The pattern analysis shows a simple picture. NIFTY gave up all the gains that it had achieved following a breakout above 18850-18900 levels. Following a full throwback, as the index retested those levels and did so on expected lines, the said levels have acted as a strong support. Now, so long as NIFTY stays above this crucial support zone of 18850-18900, it will stay in a broad trading range. Any violation of this support zone will invite weakness. On the upside, the 20-week MA, which currently stands at 19482, can be viewed as immediate resistance for the markets.
All in all, the coming week is likely to experience a positive start, and we may see the technical pullback getting extended. However, the same is likely to find resistance at 20-week MA. So long as NIFTY stays above the 18850-18900 zone, it will stay in a broad trading range. However, as the markets near the probable resistance levels, the low VIX is likely to cause trouble again, and this is something that one will need to watch. We are likely to see the markets staying extremely stock-specific; this is likely to prevent any one sector or group from dominating the performance space. While investors can continue to ride the technical rebound, it is equally important that profits are protected at higher levels. A cautiously positive approach is advised for the day.
Sector Analysis for the Coming Week
In our look at Relative Rotation Graphs®, we compared various sectors against CNX500 (NIFTY 500 Index), which represents over 95% of the free float market cap of all the stocks listed.
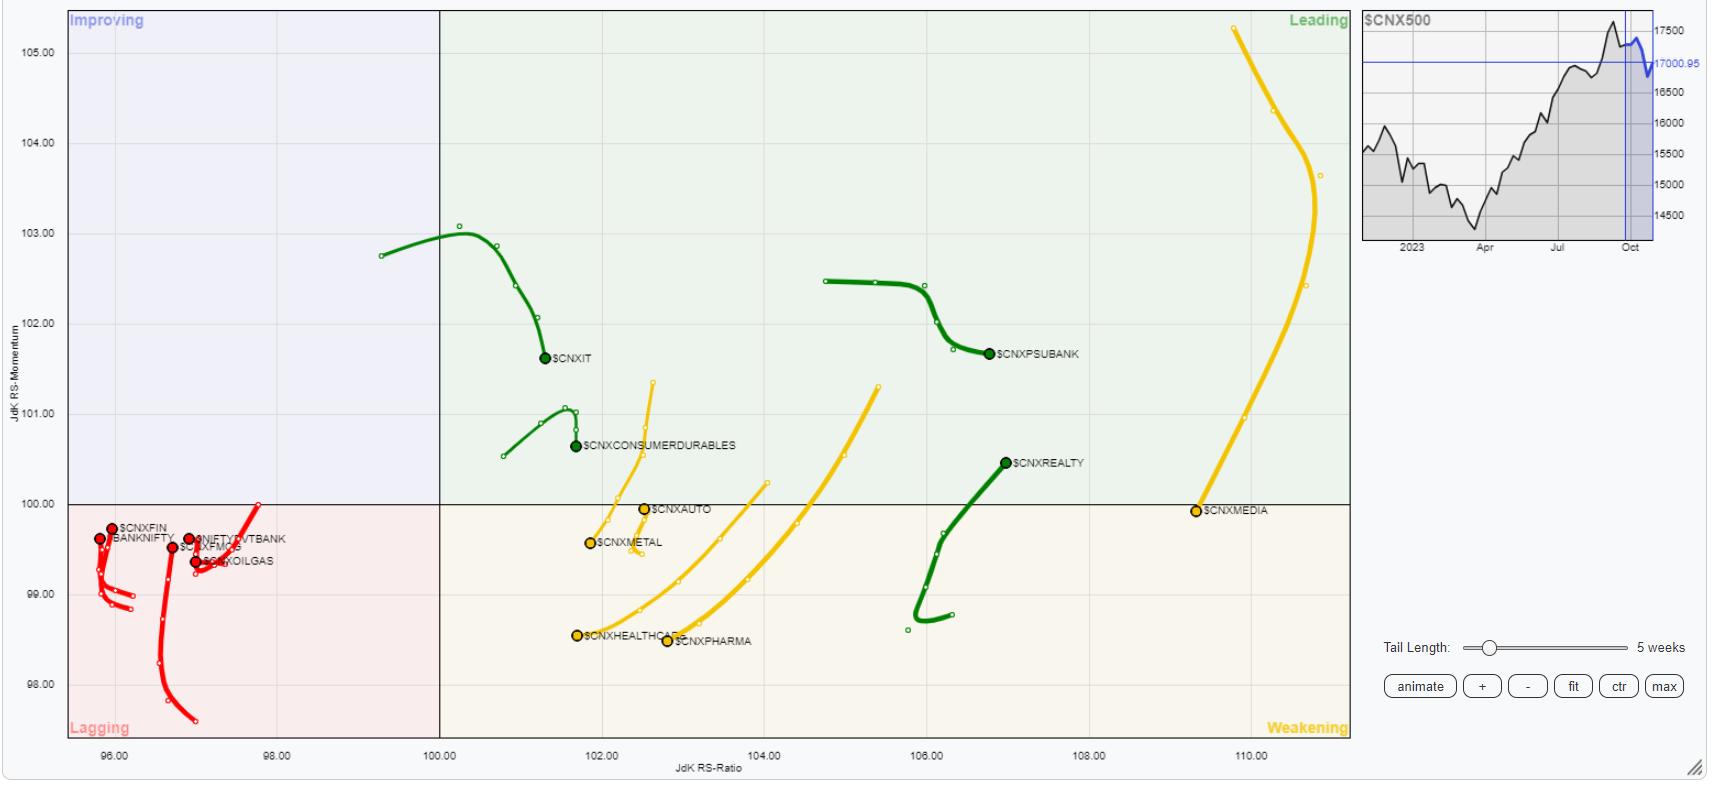
Relative Rotation Graphs (RRG) indicate that the NIFTY Energy, IT, PSE, PSU Banks, and Infrastructure indices are inside the leading quadrant. The Realty index has also rolled inside the leading quadrant. These groups are collectively likely to outperform the broader markets.
The NIFTY Mid-cap 100 index has rolled inside the weakening quadrant. The Pharma, Auto, and Metal indices are also inside the weakening quadrant.
The NIFTY Financial Service, FMCG, and BankNifty indices are inside the lagging quadrant; however, they appear to be improving on their relative momentum against the broader markets.
The NIFTY Services sector is inside the improving quadrant. Additionally, the Consumption index has also rolled inside the improving quadrant, indicating a potential beginning of its phase of relative outperformance.
Important Note: RRG™ charts show the relative strength and momentum of a group of stocks. In the above Chart, they show relative performance against NIFTY500 Index (Broader Markets) and should not be used directly as buy or sell signals.
Milan Vaishnav, CMT, MSTA
Consulting Technical Analyst
www.EquityResearch.asia | www.ChartWizard.ae


