The markets wore a largely corrective undertone throughout the past five sessions; it oscillated within a similar range as the previous week and closed on a negative note. The volatility remained on the lower side; as the volatility has been low, the bands contracted as well. As compared to the 362-point trading range in the week before this one, this time, the Nifty oscillated in a 337.40-point range before closing towards its lower end. While continuing to defend key support levels, the headline index closed with a net loss of 208.40 points (-1.06%) on a weekly basis.
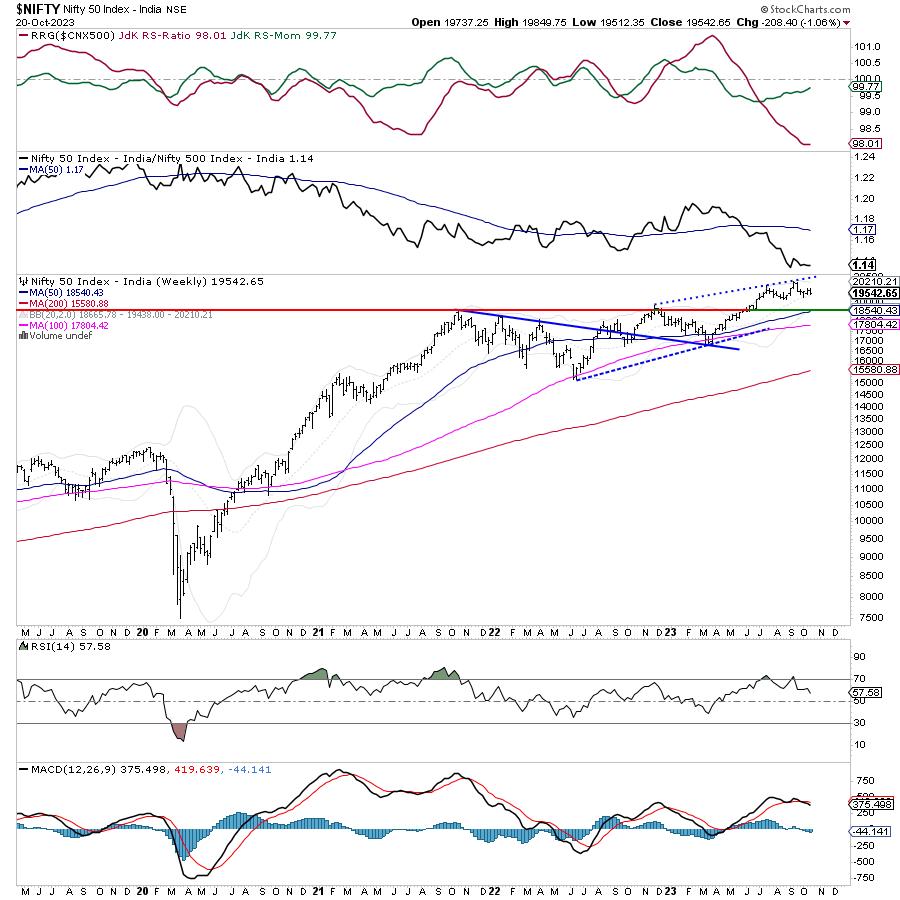
From a technical perspective, there are a few important things that one needs to keep in mind. The Nifty has again closed very near to the 20-week MA which is currently placed at 19437. This makes the level of 19400 the most important near-term support for the Nifty on a closing basis. Any violation of this point on a closing basis will take the index to its original breakout zone of 18900-19000 levels. The volatility, as represented by INDIA Vix, also remains at one of its lowest levels. The INDIAVIX rose marginally by 1.88% to 10.82 on a weekly note. This technical structure keeps the market vulnerable to profit-taking bouts from the current levels.
The coming week is a truncated week once again with Tuesday being a trading holiday on the account of Dussehra. We also have monthly derivatives expiry slated to come up later in the week. A soft start to the week is expected on Monday; the levels of 19650 and 19800 are expected to act as resistance points. The supports are likely to come in at 19400 and 19330 levels.
The weekly RSI is 57.58; it has marked a new 14-period low which is bearish. The RSI also shows a bearish divergence against the price. The weekly MACD is bearish and trades below its signal line.
The pattern analysis of the weekly chart indicates that the markets will have their upside capped and they have also dragged their resistance points lower from 20000 to 19800 levels. All technical rebounds will find resistance at this point. Further to this, the index has also closed very near to the 20-week MA currently placed at 19437. So, in the event of any extended corrective move, the index is expected to seek support at this point, i.e., the 20-week MA. If this gets violated, it will invite incremental weakness.
All in all, unless rollover and expiry-centric moves cause technical rebounds, the markets are likely to largely exhibit a continued corrective undertone. There are possibilities that defensive pockets shall do well; it would be wise to stay invested in defensive and low-beta pockets. Besides being highly stock-specific, exposures should be kept limited to those stocks that show strong relative strength against the broader markets. While cutting down on excessively leveraged positions, all up-moves, if and when they occur, should be used to protect profits. A cautious outlook is advised for the day.
Sector Analysis for the coming week
In our look at Relative Rotation Graphs®, we compared various sectors against CNX500 (NIFTY 500 Index), which represents over 95% of the free float market cap of all the stocks listed.
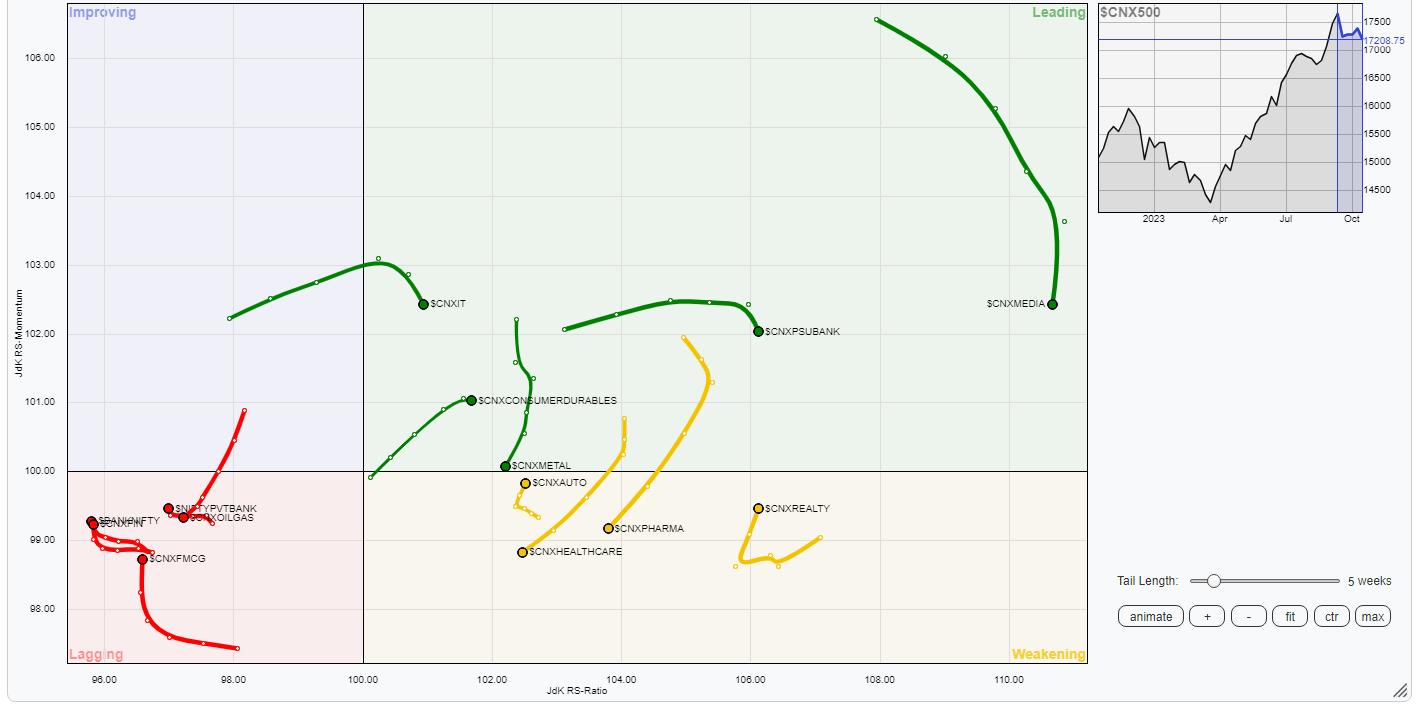
Relative Rotation Graphs (RRG) indicate that the Nifty IT, Energy, Midcap 100, Media, PSU Bank, PSE, Metal, and Infrastructure indices are inside the leading quadrant and are expected to relatively outperform the broader markets. However, some slowdown in their performance can also be expected because barring the Infrastructure and the PSE Index, all other groups are paring their relative momentum against the broader markets.
Nifty Realty, Pharma, and Auto Index are inside the weakening quadrant. Except for the Pharma index, the other two are showing strong improvement in their relative momentum against the broader markets.
The FMCG, Consumption, Financial Services, and Banknifty are inside the lagging quadrant. However, all these groups are improving their relative momentum as appears from the trajectory of the tail.
The Services Sector and the Commodities Index are inside the improving quadrant.
Important Note: RRG™ charts show the relative strength and momentum of a group of stocks. In the above Chart, they show relative performance against NIFTY500 Index (Broader Markets) and should not be used directly as buy or sell signals.
Milan Vaishnav, CMT, MSTA
Consulting Technical Analyst
www.EquityResearch.asia | www.ChartWizard.ae


