The market extended its corrective move in the previous week; over the past five sessions, it has remained quite choppy and totally devoid of any definite directional bias. It absorbed a few global jerks and saw gaps on either side of its previous close on different occasions. While the level of 25000 has now almost made itself an intermediate top for the market, the market has also appeared to have dragged its most immediate resistance points even lower. Had the market not seen a rebound on the last trading day of the week, the weekly loss could have been a bit wider.
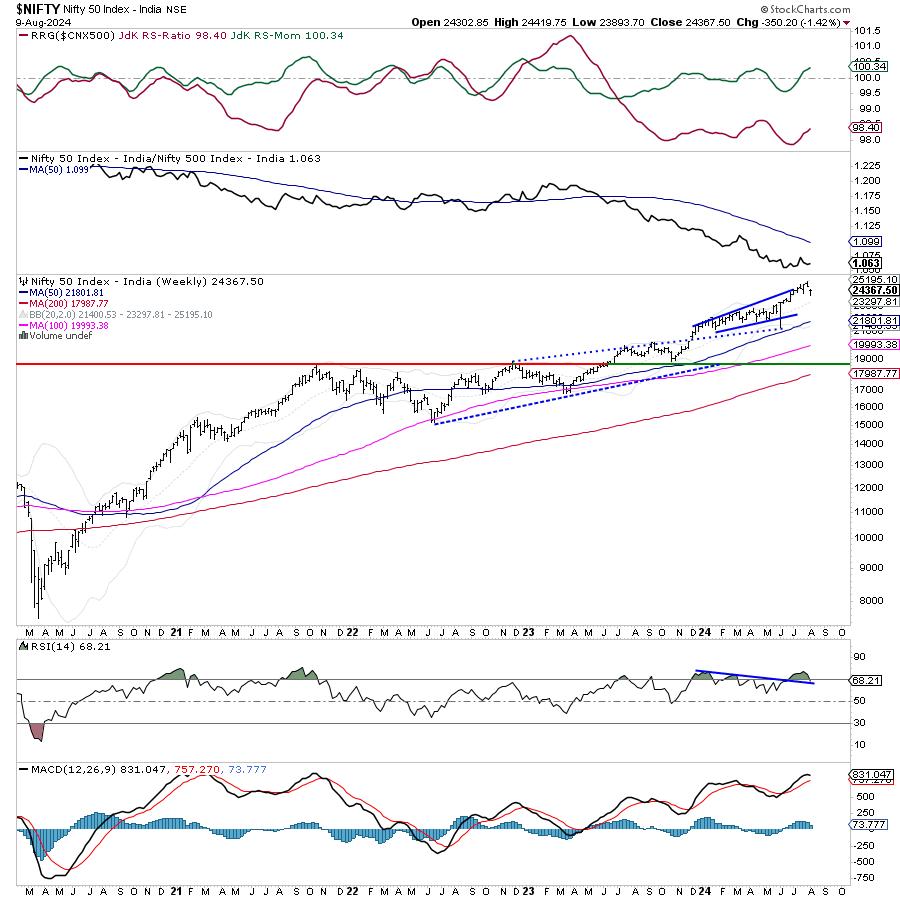
The Nifty oscillated in a 526-point trading range over the past five sessions. The IndiaVIX, the volatility gauge, surged higher by another 7.09% to 15.34. The headline index finally closed with a net weekly loss of 350.20 points (-1.42%).
The coming week is once again a truncated one; August 15th will be a trading holiday on account of Independence Day. From a short-term technical perspective, the derivative data suggest that the market may continue to remain in a narrow range while it keeps finding resistance at higher levels. No trending upmove is likely unless the zone of 24500-24650 is taken out convincingly. On the other hand, the nearest support that exists for the Nifty is the 50-DMA which is presently placed at 23967. By and large, over the next four trading sessions of the week, the index is largely expected to stay in a defined range staying volatile, but devoid of any definite directional bias.
Monday is likely to see a quiet start to the week. The levels of 24550 and 24720 are likely to act as resistance levels for the markets. The supports come in at 24090 and 23900.
The weekly RSI is 68.21; it has slipped below 70 from an overbought zone, which is bearish. It otherwise remains neutral and does not show any divergence against the price. The weekly MACD stays bullish and remains above its signal line.
A falling window occurred on candles; this is essentially a gap that generally results in the continuation of the downtrend. However, this needs to be confirmed with the general price action.
The pattern analysis of the weekly chart shows that, while the markets have started reverting very slowly back to their mean, this corrective consolidation may still last for some time. For a trending upmove to occur, the Nifty will have to move past the 24500-24750 zone. On the other hand, given the indications given by derivatives data, support exists in the form of maximum PUT OI accumulation at 24000 levels. With the 50-DMA existing at 23967, the zone of 23950-24000 becomes an important support zone for Nifty. If this zone gets violated, then we may see some incremental weakness creeping into the markets.
All in all, the markets are likely to stay highly tentative and are unlikely to see any runaway kind of upmove in the immediate future. So long as they trade below the 24500-24750 zone, all upsides are likely to get sold into; more focus should be on guarding profits at higher levels rather than chasing the up moves. While keeping fresh exposures limited to stocks with improving relative strength, overall leveraged exposures must be kept at modest levels. A cautious outlook is advised for the coming week.
Sector Analysis for the Coming Week
In our look at Relative Rotation Graphs®, we compared various sectors against CNX500 (NIFTY 500 Index), which represents over 95% of the free float market cap of all the stocks listed.
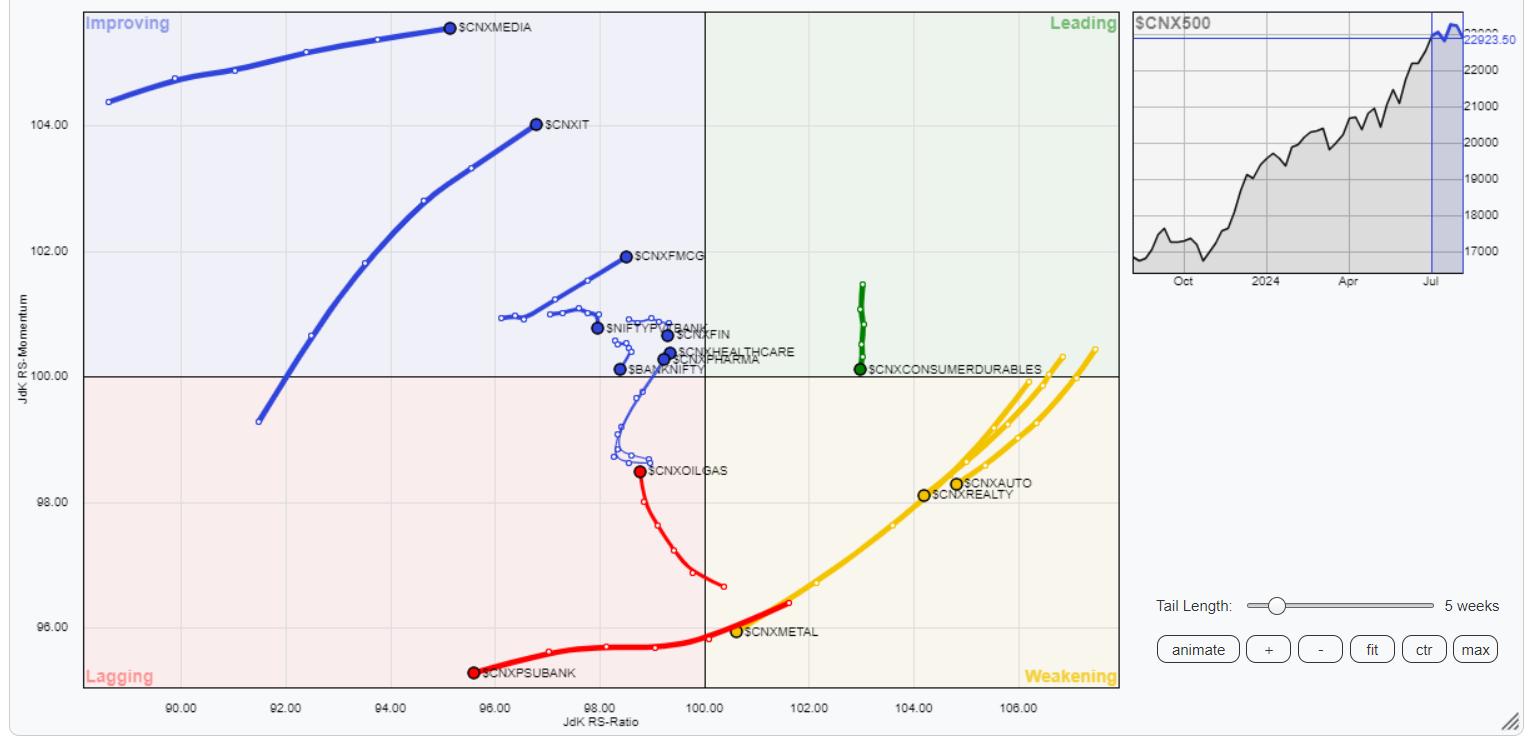
Relative Rotation Graphs (RRG) continue to show a total lack of leadership among sectors and also some defensive setup building up in the markets. The Nifty Midcap 100 is the only sector index that is present in the leading quadrant.
The Nifty Consumption Index is inside the weakening quadrant; however, it is seeing an improvement in its relative momentum against the broader markets. Besides this, the Nifty Auto, Realty, PSE, and Metal indices are also inside the weakening quadrant.
The Nifty PSU Bank Index continues languishing inside the lagging quadrant of the RRG. Besides this, the Infrastructure Index has rolled inside the lagging quadrant and is now set to underperform the broader markets relatively. The Nifty Energy Index is inside the lagging quadrant, but can be seen improving its relative momentum against the broader markets.
The Pharma Index has rolled inside the improving quadrant of the RRG; this is likely to lead to an onset of a phase of potential outperformance from this index. Besides this, the Nifty Media, IT, and FMCG indices are inside the improving quadrant and they continue to get their relative momentum better against the broader markets. The Nifty Financial Services and Nifty Bank Indices are also inside the improving quadrant; however, they are seen giving up on their relative momentum.
Important Note: RRG™ charts show the relative strength and momentum of a group of stocks. In the above Chart, they show relative performance against NIFTY500 Index (Broader Markets) and should not be used directly as buy or sell signals.
Milan Vaishnav, CMT, MSTA
Consulting Technical Analyst
www.EquityResearch.asia | www.ChartWizard.ae


